I originally posted this at http://bdgregg.blogspot.com/2006/12/dtracetoolkit-ver-0.99.html.
I've released DTraceToolkit ver 0.99 – a major release. If you haven't encountered it before, the DTraceToolkit is a collection of opensource scripts for:
- Solving various troubleshooting and performance issues
- Demonstrating what is possible with DTrace (seeing is believing)
- Learning DTrace by example
The DTraceToolkit isn't Sun's standard set of Solaris performance tools, or, everything that DTrace can do. It is a handy collection of documented and tested DTrace tools that are useful in most situations. It's certainly not a substitute for learning DTrace properly and writing your own custom scripts, although it should help you do that by providing working examples of code. It is certainly better than not using DTrace at all, if you didn't have the time to learn DTrace.
DTraceToolkit 0.96
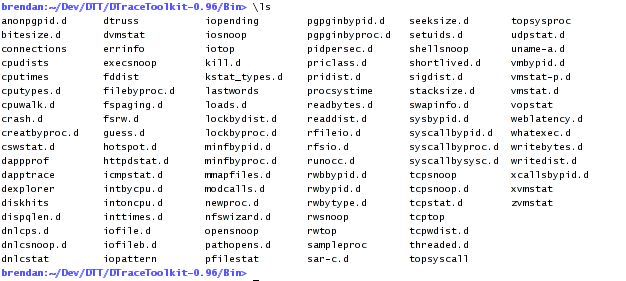
18 months ago I released version 0.96 of the DTraceToolkit. The Bin directory, which contains symlinks to all the scripts, looked like this:

Click for a larger image. That collection of scripts provides various views of system behaviour and of the interaction of applications with the system. A general theme, if there was one, was that of easy system observability: illuminating system internals that were either difficult or impossible to see before. There were 104 scripts in that release, although that is just the tip of an iceberg.
DTraceToolkit 0.99
In the last 18 months, DTrace has been expanding its horizons through the creation of numerous new DTrace providers. There are now providers for Java, JavaScript, Perl, Python, Php, Ruby, Shell and Tcl, and more on the way. The iceberg of system observability is now just one in a field of icebergs, with more rising above the surface as time goes by. It's about time the DTraceToolkit was updated to reflect the trajectory of DTrace itself, which isn't just about system observability, it is the observability of life, the universe, and everything.
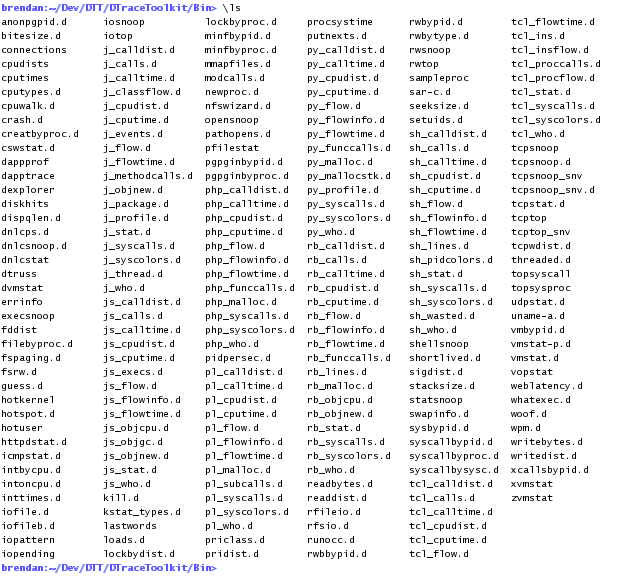
This new version of the DTraceToolkit does has a theme – that of programing language visibility – which covers several of the new DTrace providers that now exist. The Bin directory of the toolkit now contains 230 scripts, and looks like:

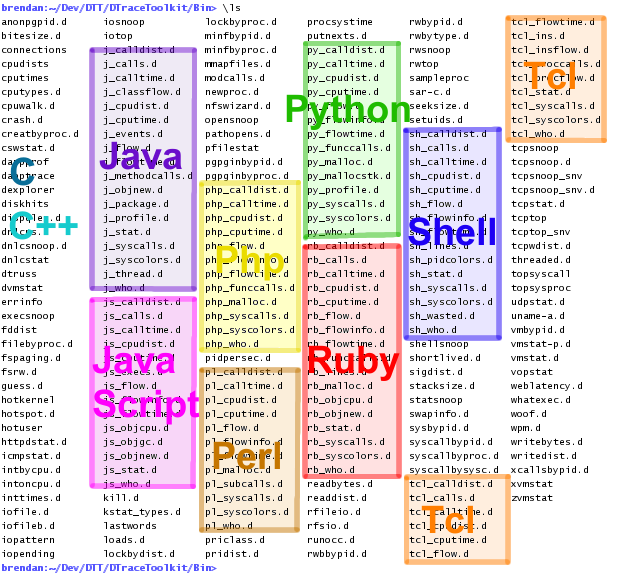
Below I've highlighted most of the new contents, grouped by language that they trace:

I've placed language scripts in their own subdirectories, each of which include a "Readme" file to document suggestions for where to find the provider and how to get it installed and working. Some of these providers do require downloading of source, patching, and compiling, which may take you some time. Both C and C++ are supported by numerous scripts, but don't have a prefix to group them like the other languages do; I hope to fix this in the next release, and actually have C and C++ subdirectories.
DTraceToolkit 0.99 change summary:
- New script categories: Java, JavaScript, Perl, Php, Python, Ruby, Shell and Tcl
- Many new scripts (script count has doubled)
- Many new example files (since there is one per script)
- A new Code directory for sample target code (used by the example files)
- Several bug fixes, numerous updates
- Updated versions of tcpsnoop/tcptop for OpenSolaris/Solaris Nevada circa late 2007
For each language, there is about a dozen scripts to provide:
- General observability (such as function and object counts, function flows)
- Performance observability (on-cpu/elapsed times, function inclusive/exclusive times, memory allocation)
- Some paths for deeper analysis (syscall and library tracing, stacks, etc)
Screenshots
Now for some examples. I'll demonstrate PHP, but the following applies to all the new languages supported in the toolkit (look in the Example directory for the language that interests you). Here is a sample PHP program that appears in the toolkit as Code/Php/func_abc.php:
/opt/DTT> cat -n Code/Php/func_abc.php
  1  <?php
  2  function func_c()
  3  {
  4          echo "Function C\n";
  5          sleep(1);
  6  }
  7
  8  function func_b()
  9  {
 10          echo "Function B\n";
 11          sleep(1);
 12          func_c();
 13  }
 14
 15  function func_a()
 16  {
 17          echo "Function A\n";
 18          sleep(1);
 19          func_b();
 20  }
 21
 22  func_a();
 23  ?>
For general observability there are scripts such as php_funccalls.php, for counting function calls:
# php_funccalls.d
Tracing... Hit Ctrl-C to end.
^C
FILE                             FUNC                                CALLS
func_abc.php                     func_a                                  1
func_abc.php                     func_b                                  1
func_abc.php                     func_c                                  1
func_abc.php                     sleep                                   3
The above output showed that sleep() was called three times, and the user defined functions were each called once, as we would have assumed from the source. With DTrace you can check your assumptions through tracing, which is often a useful excercise. I've solved many performance issues by examining areas that seem almost too obvious to bother checking.
The following script is both for general and performance observability. It prints function flow along with delta times:
# php_flowtime.d
  C TIME(us)         FILE             DELTA(us)  -- FUNC
  0 3646108339057    func_abc.php             9 -> func_a
  0 3646108339090    func_abc.php            32   -> sleep
  0 3646109341043    func_abc.php       1001953   <- sleep
  0 3646109341074    func_abc.php            31   -> func_b
  0 3646109341098    func_abc.php            23     -> sleep
  0 3646110350712    func_abc.php       1009614     <- sleep
  0 3646110350745    func_abc.php            32     -> func_c
  0 3646110350768    func_abc.php            23       -> sleep
  0 3646111362323    func_abc.php       1011554       <- sleep
  0 3646111362351    func_abc.php            27     <- func_c
  0 3646111362361    func_abc.php            10   <- func_b
  0 3646111362370    func_abc.php             9 <- func_a
^C
Delta times, in this case, show the time from the line on which they appear to the previous line. The large delta times visible show that from when the sleep() function completed to when it began, took around 1.0 seconds of elapsed time. As we'd expect from the source. Both CPU (C) and time since boot (TIME(us)) are printed in case the output is shuffled on multi-CPU systems, and requires post sorting.
A more consise way to examine elapsed times may be php_calltime.d, a script that can be useful for performance analysis:
# php_calltime.d
Tracing... Hit Ctrl-C to end.
^C

Count,
FILE                 TYPE       NAME                                COUNT
func_abc.php         func       func_a                                  1
func_abc.php         func       func_b                                  1
func_abc.php         func       func_c                                  1
func_abc.php         func       sleep                                   3
-                    total      -                                       6

Exclusive function elapsed times (us),
FILE                 TYPE       NAME                                TOTAL
func_abc.php         func       func_c                                330
func_abc.php         func       func_b                                367
func_abc.php         func       func_a                                418
func_abc.php         func       sleep                             3025644
-                    total      -                                 3026761

Inclusive function elapsed times (us),
FILE                 TYPE       NAME                                TOTAL
func_abc.php         func       func_c                            1010119
func_abc.php         func       func_b                            2020118
func_abc.php         func       sleep                             3025644
func_abc.php         func       func_a                            3026761
The exclusive function elapsed times show which functions cused the latency, which identifies sleep() clocking a total of 3.0 seconds (as it was called three times). The inclusive times show which higher level functions the latency occured in, the largest being func_a() since every other function were called within it. There isn't a total line printed for inclusive times, since it wouldn't make much sense to do so (that column sums to 9 seconds, which is more confusing than of actual use).
As a starting point for deeper analysis, the following script adds syscall tracing to the PHP function flows, and adds terminal escape colours (see Notes/ALLcolors_notes.txt for notes on using colors with DTrace):
# php_syscolors.d
C    PID/TID   DELTA(us)              FILE:LINE TYPE     -- NAME
0  18426/1             8      func_abc.php:22   func     -> func_a
0  18426/1            41      func_abc.php:18   func       -> sleep
0  18426/1            15                 ":-    syscall      -> nanosleep
0  18426/1       1008700                 ":-    syscall      <- nanosleep
0  18426/1            30      func_abc.php:18   func       <- sleep
0  18426/1            42      func_abc.php:19   func       -> func_b
0  18426/1            28      func_abc.php:11   func         -> sleep
0  18426/1            14                 ":-    syscall        -> nanosleep
0  18426/1       1010083                 ":-    syscall        <- nanosleep
0  18426/1            29      func_abc.php:11   func         <- sleep
0  18426/1            43      func_abc.php:12   func         -> func_c
0  18426/1            28      func_abc.php:5    func           -> sleep
0  18426/1            14                 ":-    syscall          -> nanosleep
0  18426/1       1009794                 ":-    syscall          <- nanosleep
0  18426/1            28      func_abc.php:5    func           <- sleep
0  18426/1            34      func_abc.php:6    func         <- func_c
0  18426/1            18      func_abc.php:13   func       <- func_b
0  18426/1            17      func_abc.php:20   func     <- func_a
0  18426/1            21                 ":-    syscall  -> fchdir
0  18426/1            19                 ":-    syscall  <- fchdir
0  18426/1             9                 ":-    syscall  -> close
0  18426/1            13                 ":-    syscall  <- close
0  18426/1            35                 ":-    syscall  -> semsys
0  18426/1            12                 ":-    syscall  <- semsys
0  18426/1             7                 ":-    syscall  -> semsys
0  18426/1             7                 ":-    syscall  <- semsys
0  18426/1            66                 ":-    syscall  -> setitimer
0  18426/1             8                 ":-    syscall  <- setitimer
0  18426/1            39                 ":-    syscall  -> read
0  18426/1            14                 ":-    syscall  <- read
0  18426/1            11                 ":-    syscall  -> writev
0  18426/1            22                 ":-    syscall  <- writev
0  18426/1            23                 ":-    syscall  -> write
0  18426/1           110                 ":-    syscall  <- write
0  18426/1            61                 ":-    syscall  -> pollsys
From that output we can see that PHP's sleep() is implemented by the syscall nanosleep(), and that it appears that writes are buffered and written later.
Understanding the language scripts
The scripts are potentially confusing for a couple of reasons; understanding these will help explain how best to use these scripts.
Firstly, some of the scripts print out an event "TYPE" field (eg, "syscall" or "func"), and yet the script only traces one type of event (eg, "func"). Why print a field that will always contain the same data? Sounds like it might be a copy-n-paste error. This is in fact deliberate so that the scripts form better templates for expansion, and was something I learnt while using the scripts to analyse a variety of problems. I would frequently have a script that measured functions and wanted to add syscalls, library calls or kernel events, to customise that script for a particular problem. When adding these other event types, it was much easier (often trivial) if the script already had a "TYPE" field. So now most of them do.
Also, there are variants of scripts that provide very similar tracing at different depths of detail. Why not one script that does everything, with the most detail? Here I'll use the Tcl provider to explain why:
The tcl_proccalls.d script counts procedure calls, here it is tracing the Code/Tcl/func_slow.tcl program in the toolkit, which calls loops within functions:
# tcl_proccalls.d
Tracing... Hit Ctrl-C to end.
^C
 PID    COUNT PROCEDURE
183083        1 func_a
183083        1 func_b
183083        1 func_c
183083        1 tclInit
Ok, that's a very high level view of Tcl activity. There is also tcl_calls.d to count Tcl commands as well as procedures:
# tcl_calls.d
Tracing... Hit Ctrl-C to end.
^C
 PID TYPE     NAME                                                    COUNT
[...]
183086 proc     func_a                                                      1
183086 proc     func_b                                                      1
183086 proc     func_c                                                      1
183086 proc     tclInit                                                     1
[...]
183086 cmd      if                                                          8
183086 cmd      info                                                       11
183086 cmd      file                                                       12
183086 cmd      proc                                                       12
(Output truncated). Now we have a deeper view of Tcl operation. Finally there is tcl_ins.d to count Tcl instructions:
# tcl_ins.d
Tracing... Hit Ctrl-C to end.
^C
 PID TYPE     NAME                                                    COUNT
[...]
16005 inst     jump1                                                      14
16005 inst     pop                                                        18
16005 inst     invokeStk1                                                 53
16005 inst     add                                                    600000
16005 inst     concat1                                                600000
16005 inst     exprStk                                                600000
16005 inst     lt                                                     600007
16005 inst     storeScalar1                                           600016
16005 inst     done                                                   600021
16005 inst     loadScalar1                                           1200020
16005 inst     push1                                                 4200193
There are such large counts since this script is tracing the low level instructions used to execute the loops in this code.
So the question is: why three scripts and not one that counts everything? Why not tcl_megacount.d? There are at least three reasons behind this.
You don't pull out a microscope if you are looking for your umbrella. Tracing everything can really bog you down in detail, when higher level views are frequently sufficient for solving issues. It's a matter of the right tool for the job. Try the higher level scripts first, then dig deeper as needed.
Example programs. Writing mega powerful DTrace scripts often means mega confusing scripts to read. People use the DTraceToolkit as a collection of example code to learn from, so keeping things simple if possible, should help.
Measuring at such a low level can have a significant performance impact. I'll demonstrate this next by using ptime as a easy (but rough) measurement of run time for the Code/Tcl/func_slow.tcl sample program.
Here is func_slow.tcl running with no DTrace enabled as a baseline:
# ptime ./func_slow.tcl > /dev/null

real        3.306
user        3.276
sys         0.005
Now while tcl_proccalls.d is tracing procedure calls:
# ptime ./func_slow.tcl > /dev/null

real        3.311
user        3.270
sys         0.006
Now while tcl_calls.d is tracing both Tcl procedures and commands:
#  ptime ./func_slow.tcl > /dev/null

real        3.313
user        3.283
sys         0.006
Finally with tcl_ins.d tracing Tcl instructions:
# ptime ./func_slow.tcl > /dev/null

real       20.438
user       20.278
sys         0.010
Ow! Our target application is running seven times slower? This isn't supposed to happen, is there something wrong with DTrace or the Tcl provider? Well, there isn't, the problem is that of tracing 9 million events during a 3 second program. The overheads of DTrace are miniscule, however, if you multiply them (or anything) by very large numbers they'll eventually become measurable. 9 million events is a lot of events, and you wouldn't normally care about tracing Tcl instructions anyway. It's great to have this capability, if it is ever needed.
Documentation
It usually takes more time to document a script than it takes to write it. I feel strongly about creating quality IT documentation, so I'm reluctant to skip this step. The strategy used in the toolkit is, by subdirectory name:
- Scripts: these have a standard header plus inline comments.
- Examples: this is a directory of example files that demonstrate each script, providing screenshots and interpretations of the output. Particular attention has been made to explain relevant details, especially caveats, no matter how obvious they may seem.
- Notes: this is a directory of files that comment on a variety of topics that are relevant to multiple scripts. There are many more notes files in this toolkit release.
- Man pages: there is a directory for these, which are useful for looking up field definitions and units. To be honest, I frequently use the Examples directory for reminders on what each tool does rather than the Man pages.
Since there were over 100 new scripts in this release, over 100 new example files needed to be written. Fortunately I had help from Claire Black (my wife), who as an ex-SysAdmin and Solaris Instructor had an excellent background for what people needed to know and how to express it. Unfortunately for her, she only had about 4 days from when I completed these scripts to when the documentation was due for inclusion on the next OpenSolaris Starter Kit disc. Despite the time constraint she has done a great job, and there is always the next release for her to spend more time fleshing out the examples further. I'm also aiming to collect more real-world example outputs for the next release (eg, Mediawiki analysis for the PHP scripts).
Testing
Stefan Parvu has helped out again by running every script on a variety of platforms, which is especially important now that I don't have a SPARC server at the moment. He has posted the results on the DTraceToolkit Testing Room, and did find a few bugs which I fixed before release.
Personal
It has been about 18 months since the last release. In case anyone was wondering, there are several reasons why, briefly: I moved to the US, began a new job in Sun engineering, left most of my development servers behind in Australia, brought the DTraceToolkit dev environment over on a SPARC UFS harddisk (which I still can't read), and got hung up on what to do with the fragile tcp* scripts. The main reason would be having less spare time as I learnt the ways of Sun engineering.
I also have a Sun blog now, here. I'm not announcing the DTraceToolkit there since it isn't a Sun project; it's a spare time project by myself and others of the OpenSolaris community.
Future
The theme for the next release may be storage: I'd like to spend some time seeing what can be done for ZFS, for iSCSI (using the new provider), and NFS.

