I originally posted this at http://blogs.sun.com/brendan/entry/latency_art_x_marks_the.
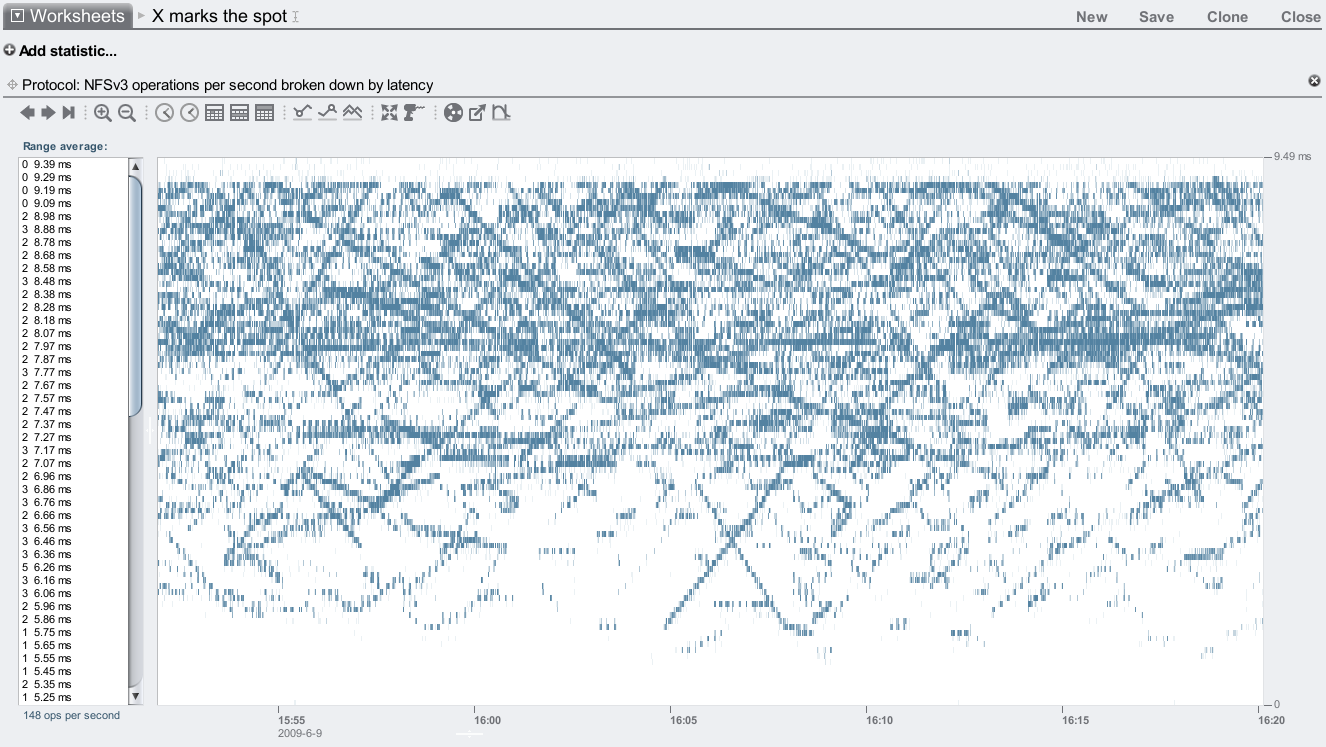
Here is another example of latency art (interesting I/O latency heat maps). This is a screenshot from Analytics on the Sun Storage 7000 series.
The configuration was 2 JBODs (48 disks) configured with mirroring, and a single NFS client performing a synchronous write workload (opened with O_DSYNC), from one thread writing 8 Kbyte I/O sequentially. This is a crippled config. If you really cared about synchronous writes (some applications perform them) you can use SSD based separate intent logs ("Logzillas") which are part of the Hybrid Storage Pool strategy. Since I didn't, these synchronous writes will be served at disk speed, which for these 7200 RPM disks will be between 0 and 10 ms. Here's the latency (click for a larger version):

Woah! That's Insane.
This is not what I was expecting. Remember that this workload is very simple – just one thread performing sequential synchronous writes. The magnitude of the latency is as expected for these disks (and no Logzilla), but the strange diagonal lines? Latency is creeping up or down second after second, sometimes at the same time (the 'X's.) It looks a bit like an icy lake, and this particular example has a distinct 'X' in it.
I'd guess this is related to how ZFS is placing the data sequentially on disks as they rotate, perhaps each diagonal represents one track. With time this can be answered using DTrace; the first step would be to see if individual disks contribute single lines to the heat map...
The point of this post is to show another interesting latency heat map, one that we don't yet fully understand (leave a comment if you have another theory about why this happens.)
Before Analytics, I analyzed disk latency using averages or coarse distributions, which don't have the resolution to reveal patterns like this. Indeed, for other filesystems (UFS, ...) there may be similar or even more bizarre patterns.
In my next post I'll demo Logzillas – the solution to this latency.

