I originally posted this at http://dtrace.org/blogs/brendan/2011/03/08/dtrace-book-talk-sf.
Tomorrow (Wednesday, March 9th) I'll give a talk at SFOSUG about DTrace Book highlights, especially from Chapter 5 File Systems, which is available to download and read beforehand as a sample chapter. We'll also have one pre-print copy to give out to one lucky guest.
Here is a text-based screenshot of DTracing file systems to whet your appetite:
solaris# perturbation.d zfs_ioc_snapshot
Tracing ZFS perturbation by zfs_ioc_snapshot()... Ctrl-C to end.
^C

  zfs_write                                           normal (ms)
           value  ------------- Distribution ------------- count
              -1 |                                         0
               0 |@@@@@@@@@@@@@@@@@@@@@@@@@@@@@@@@@@@@@@@@ 348381
               1 |                                         7
               2 |                                         0

  zfs_write                                           during perturbation (ms)
           value  ------------- Distribution ------------- count
              -1 |                                         0
               0 |@@@@@@@@@@@@@@@@@@@@@@@@@@@@@@@@@@@@@@@@ 276029
               1 |                                         11
               2 |                                         5
               4 |                                         0

  zfs_ioc_snapshot                                    perturbation duration (ms)
           value  ------------- Distribution ------------- count
             512 |                                         0
            1024 |@@@@@@@@@@@@@@@@@@@@@@@@@@@              2
            2048 |@@@@@@@@@@@@@                            1
            4096 |                                         0

  zfs_read                                            during perturbation (ms)
           value  ------------- Distribution ------------- count
              -1 |                                         0
               0 |@                                        5
               1 |                                         0
               2 |                                         0
               4 |                                         3
               8 |@@@@@@@@@@@@                             77
              16 |@@@@@@@@@@@@@@@@@@                       117
              32 |@@@@                                     26
              64 |@@                                       16
             128 |@                                        8
             256 |                                         2
             512 |@                                        5
            1024 |                                         0

  zfs_read                                            normal (ms)
           value  ------------- Distribution ------------- count
              -1 |                                         0
               0 |@@@@                                     97
               1 |                                         0
               2 |                                         0
               4 |@                                        29
               8 |@@@@@@@@@@@@@@@@@@@@@@@@                 563
              16 |@@@@@@@@@@                               241
              32 |                                         10
              64 |                                         1
             128 |                                         0
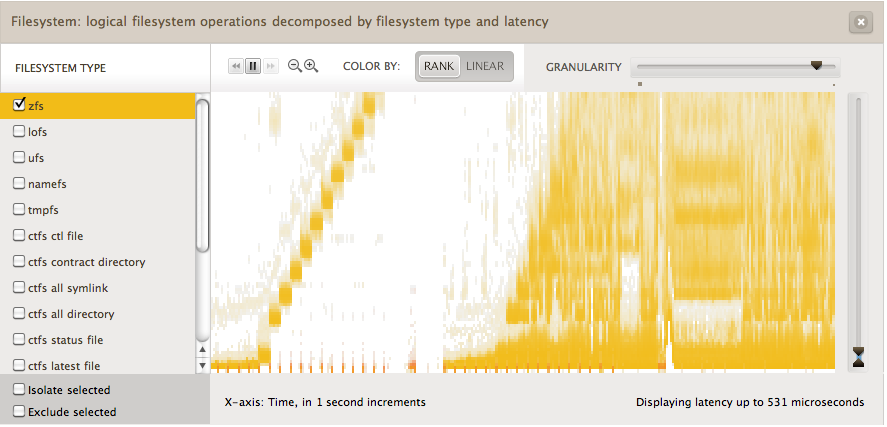
But it won't all be text; here is a DTrace-based visualization of file system latency:

If you are interested in DTrace and are in San Francisco, come by and I'll see you there!
If you can't make it in person, it should be on ustream by Deirdré (ustream viewers are also eligible for the book drawing).

