My previous post introduced off-wake time flame graphs[1], which marry off-CPU stack traces with wakeup stack traces. These provide better insight as to why threads have blocked. However, they don't solve everything.
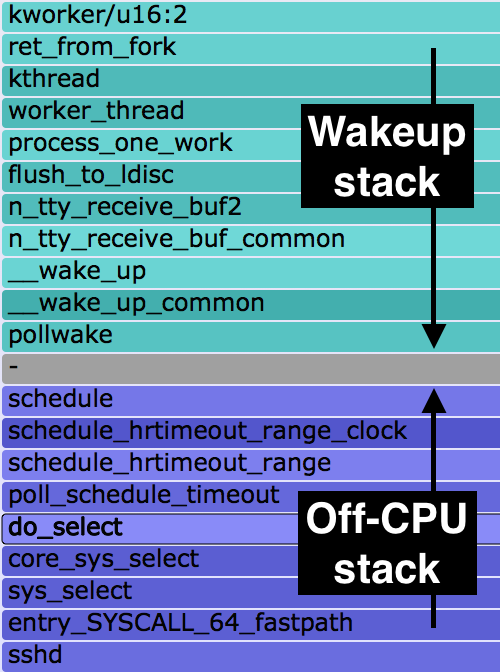
An example from my previous post is on the right. This shows "sshd", with the off-CPU stack at the bottom and the waker stack on top (full SVG). So sshd is blocked on sys_select(), which is woken up by kworker threads (kworker/u16:2) doing tty_receive_buf handling. Sounds like sshd is reading from a pipe. But who is at the other end of the pipe?
The problem becomes: who is waking the waker? And who is waking them?
Can't I trace all the waker stacks, and assemble the entire chain?
Chain Graph Prototype
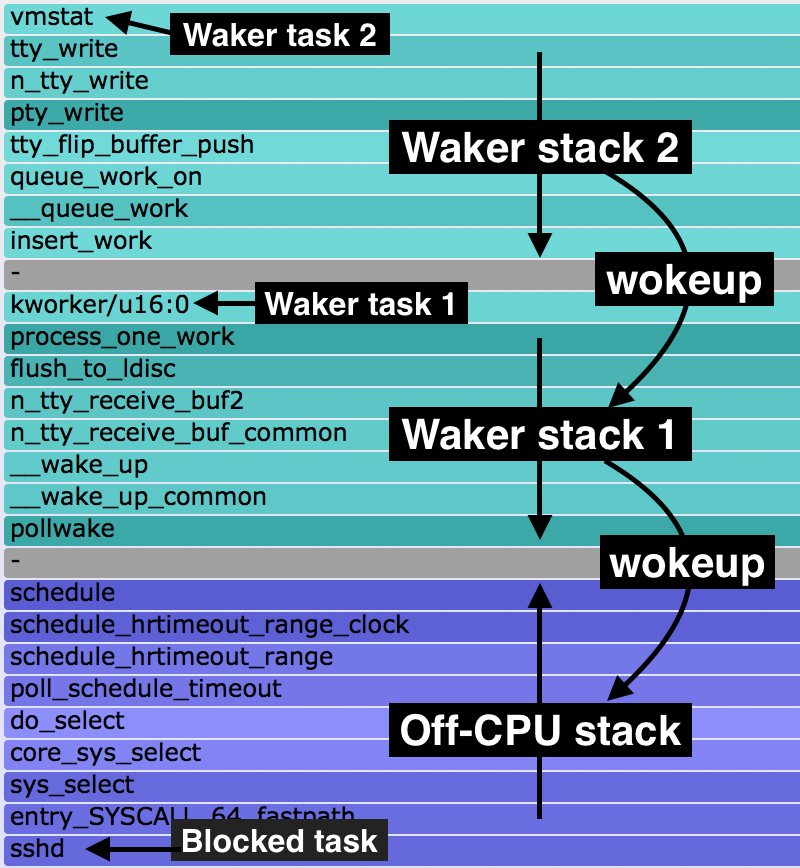
Chain graphs show why your threads have blocked, along with the entire chain of wakeup stacks that led to their resumption. So far they have been a fanciful idea that I introduced and prototyped for a USENIX LISA 2013 talk on flame graphs[2][3][4]. With Linux eBPF, we're getting closer to these becoming a practical tool. eBPF can trace with very low overhead, and store and retrieve stack traces in kernel probe context.
Here's an eBPF prototype which has two levels of waker stacks, and includes all threads (SVG):
Many of these are idle, waiting for work on a file descriptor via a sys_poll() or sys_select(), and woken up by a timer interrupt. The widths are the total time the off-CPU stack was blocked until its wakeup. Since this sums all time, it visualizes where time is spent on average, and identifies possible tuning targets.
Try clicking on "sshd" (bottom to the left of supervise). Wow! "vmstat" woke up "kworker/u16:0", which woke up "sshd", and this was for 9.0 seconds in total. I had a "vmstat 1" running in one shell, and we're seeing 9 x 1 second updates during this 10 second profile. This layout is shown on the right.
All roads lead to metal.
You can imagine going further and showing all wakeup stacks, not just the first two. I'd prototyped this for my LISA talk, and found that all paths eventually lead to metal: hardware interrupts or timers wake up everything. The path from your application to metal explains why it blocked for so long.
The program I'm using, chaintest, is a work in progress and not yet in bcc tools[5]. Perhaps by the time you are reading this it will be finished, and published as "chaingraph".
Current Issues
You may not care much about the current issues right now, which will become out of date as eBPF and bcc are developed. For completion, here are the current issues and things that need work:
- I limited waker stacks to 7 frames each, as my stack trace hack[6] hits the MAX_BPF_STACK limit (512). We need eBPF stack support, which Alexei Starovoitov is working on (he's also now at Facebook).
- This prototype is kernel stacks only. eBPF stack support will give us the user-stacks too.
- It's currently only showing the last chain of wakeups. Needs to handle more complex chains.
- All threads are shown, which leads to some duplication. Eg, thread A shows A->B->C, and thread B shows (to some extent) B->C; we can probably exclude thread B.
- Cleanup per-thread timestamps and stacks, to avoid exhausting a BPF_HASH table (10240 default).
The greatest challenge may be keeping the overhead of this tool low enough to be acceptable. eBPF helps as it has low overhead, and I am doing all in-kernel summaries, however, scheduler events can be very frequent. This area needs more work, testing, and quantification.
Future
Imagine chain graphs: a visualization that explains not only why application threads blocked, but shows the full reason as to why they blocked for so long: the full wakeup chain. If we can use these in production, they should solve many system issues, and will be complementary to CPU flame graphs.
Chain graphs won't solve everything (latency outliers is one example of a performance issue not addressed by these...yet), but they will be a good start. It's been worth prototyping these on Linux now, while eBPF and bcc are still in development, to give us a use case to work towards.
References & Links
- http://www.brendangregg.com/blog/2016-02-01/linux-wakeup-offwake-profiling.html
- https://www.usenix.org/conference/lisa13/technical-sessions/plenary/gregg
- https://youtu.be/nZfNehCzGdw?t=1h21m48s
- http://www.brendangregg.com/FlameGraphs/offcpuflamegraphs.html#ChainGraph
- https://github.com/iovisor/bcc#tracing
- http://www.brendangregg.com/blog/2016-01-18/ebpf-stack-trace-hack.html


Click here for Disqus comments (ad supported).