AWS re:Invent 2017: How Netflix Tunes EC2 Instances for Performance
Video: https://www.youtube.com/watch?v=89fYOo1V2pACMP325 talk for AWS re:Invent 2017, by Brendan Gregg.
Description: "At Netflix we make the best use of AWS EC2 instance types and features to create a high performance cloud, achieving near bare metal speed for our workloads. This session will summarize the configuration, tuning, and activities for delivering the fastest possible EC2 instances, and will help other EC2 users improve performance, reduce latency outliers, and make better use of EC2 features. We'll show how we choose EC2 instance types, how we choose between EC2 Xen modes: HVM, PV, and PVHVM, and the importance of EC2 features such SR-IOV for bare-metal performance. SR-IOV is used by EC2 enhanced networking, and recently for the new i3 instance type for enhanced disk performance as well. We'll also cover kernel tuning and observability tools, from basic to advanced. Advanced performance analysis includes the use of Java and Node.js flame graphs, and the new EC2 Performance Monitoring Counter (PMC) feature released this year."
| next prev 1/63 | |
| next prev 2/63 | |
| next prev 3/63 | |
| next prev 4/63 | |
| next prev 5/63 | |
| next prev 6/63 | |
| next prev 7/63 | |
| next prev 8/63 | |
| next prev 9/63 | |
| next prev 10/63 | |
| next prev 11/63 | |
| next prev 12/63 | |
| next prev 13/63 | |
| next prev 14/63 | |
| next prev 15/63 | |
| next prev 16/63 | |
| next prev 17/63 | |
| next prev 18/63 | |
| next prev 19/63 | |
| next prev 20/63 | |
| next prev 21/63 | |
| next prev 22/63 | |
| next prev 23/63 | |
| next prev 24/63 | |
| next prev 25/63 | |
| next prev 26/63 | |
| next prev 27/63 | |
| next prev 28/63 | |
| next prev 29/63 | |
| next prev 30/63 | |
| next prev 31/63 | |
| next prev 32/63 | |
| next prev 33/63 | |
| next prev 34/63 | |
| next prev 35/63 | |
| next prev 36/63 | |
| next prev 37/63 | |
| next prev 38/63 | |
| next prev 39/63 | |
| next prev 40/63 | |
| next prev 41/63 | |
| next prev 42/63 | |
| next prev 43/63 | |
| next prev 44/63 | |
| next prev 45/63 | |
| next prev 46/63 | |
| next prev 47/63 | |
| next prev 48/63 | |
| next prev 49/63 | |
| next prev 50/63 | |
| next prev 51/63 | |
| next prev 52/63 | |
| next prev 53/63 | |
| next prev 54/63 | |
| next prev 55/63 | |
| next prev 56/63 | |
| next prev 57/63 | |
| next prev 58/63 | |
| next prev 59/63 | |
| next prev 60/63 | |
| next prev 61/63 | |
| next prev 62/63 | |
| next prev 63/63 |
PDF: AWSreInvent2017_performance_tuning_EC2.pdf
Keywords (from pdftotext):
slide 1:
CMP325
How Netflix Tunes
EC2 Instances for
Performance
Brendan Gregg, Performance and OS Engineering Team
November 28, 2017
© 2017, Amazon Web Services, Inc. or its Affiliates. All rights reserved.
slide 2:
© 2017, Amazon Web Services, Inc. or its Affiliates. All rights reserved.slide 3:
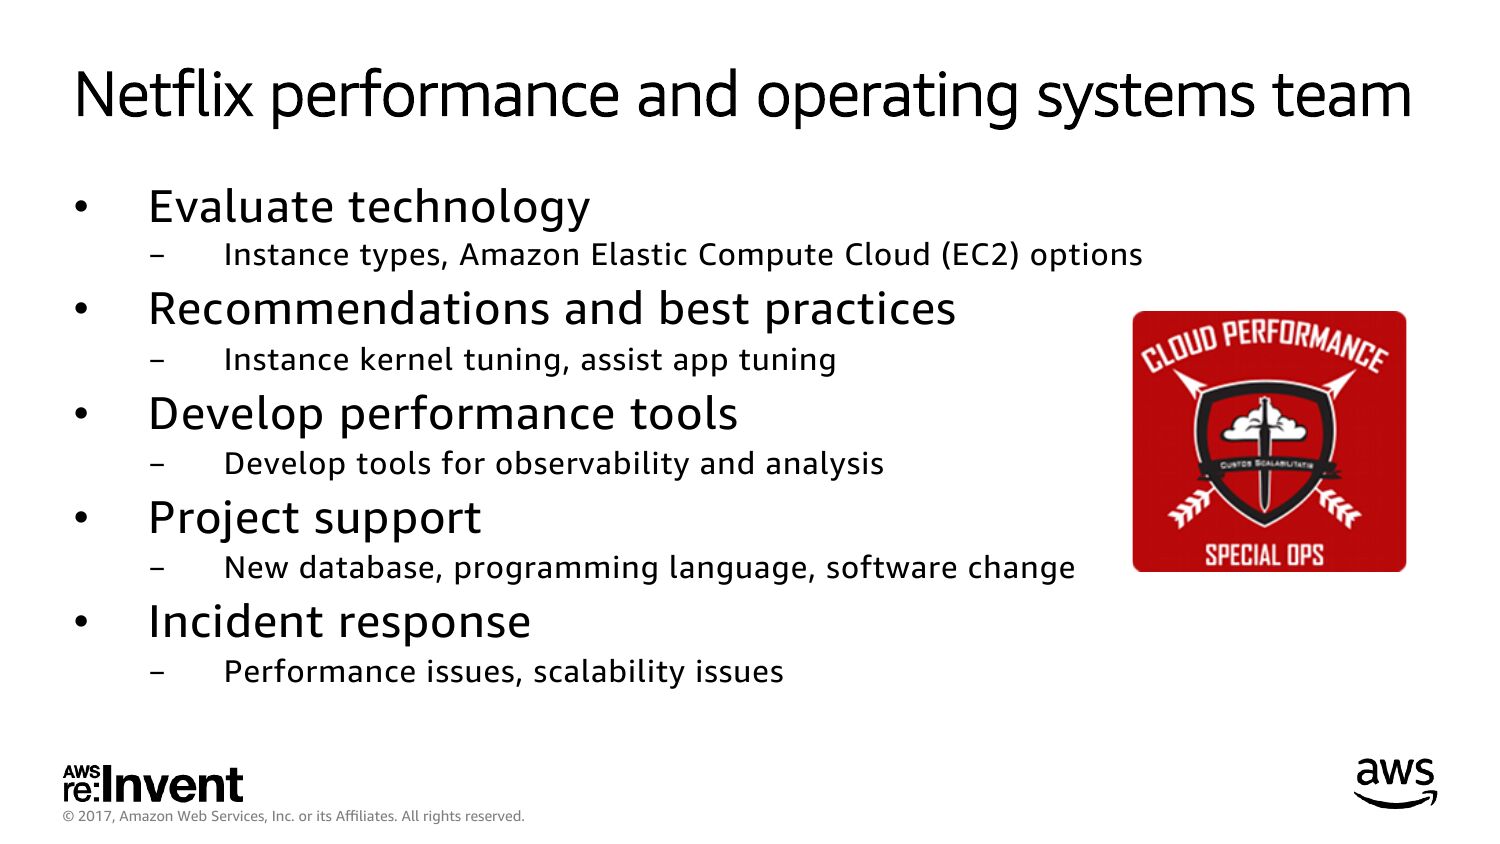
Netflix performance and operating systems team
Evaluate technology
Recommendations and best practices
Develop tools for observability and analysis
Project support
Instance kernel tuning, assist app tuning
Develop performance tools
Instance types, Amazon Elastic Compute Cloud (EC2) options
New database, programming language, software change
Incident response
Performance issues, scalability issues
© 2017, Amazon Web Services, Inc. or its Affiliates. All rights reserved.
slide 4:
Agenda
Instance selection
Amazon EC2 features
Kernel tuning
Methodologies
Observability
© 2017, Amazon Web Services, Inc. or its Affiliates. All rights reserved.
slide 5:
Warnings
This is what’s in our medicine cabinet
Consider these “best before: 2018”
Take only if prescribed by a performance engineer
© 2017, Amazon Web Services, Inc. or its Affiliates. All rights reserved.
slide 6:
1. Instance selection
© 2017, Amazon Web Services, Inc. or its Affiliates. All rights reserved.
slide 7:
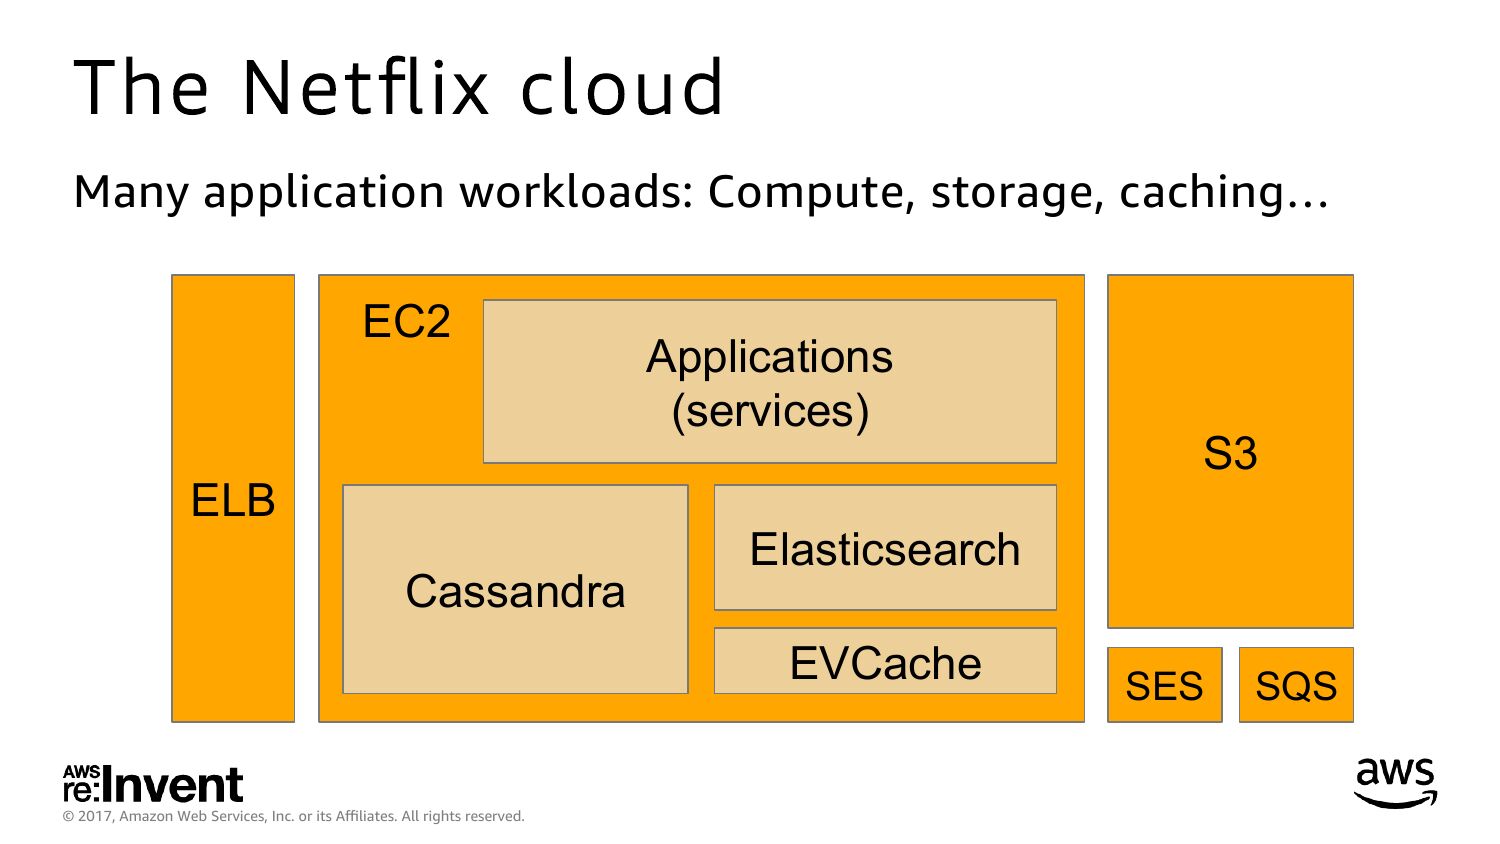
The Netflix cloud
Many application workloads: Compute, storage, caching…
EC2
ELB
Cassandra
Applications
(services)
Elasticsearch
EVCache
© 2017, Amazon Web Services, Inc. or its Affiliates. All rights reserved.
SES
SQS
slide 8:
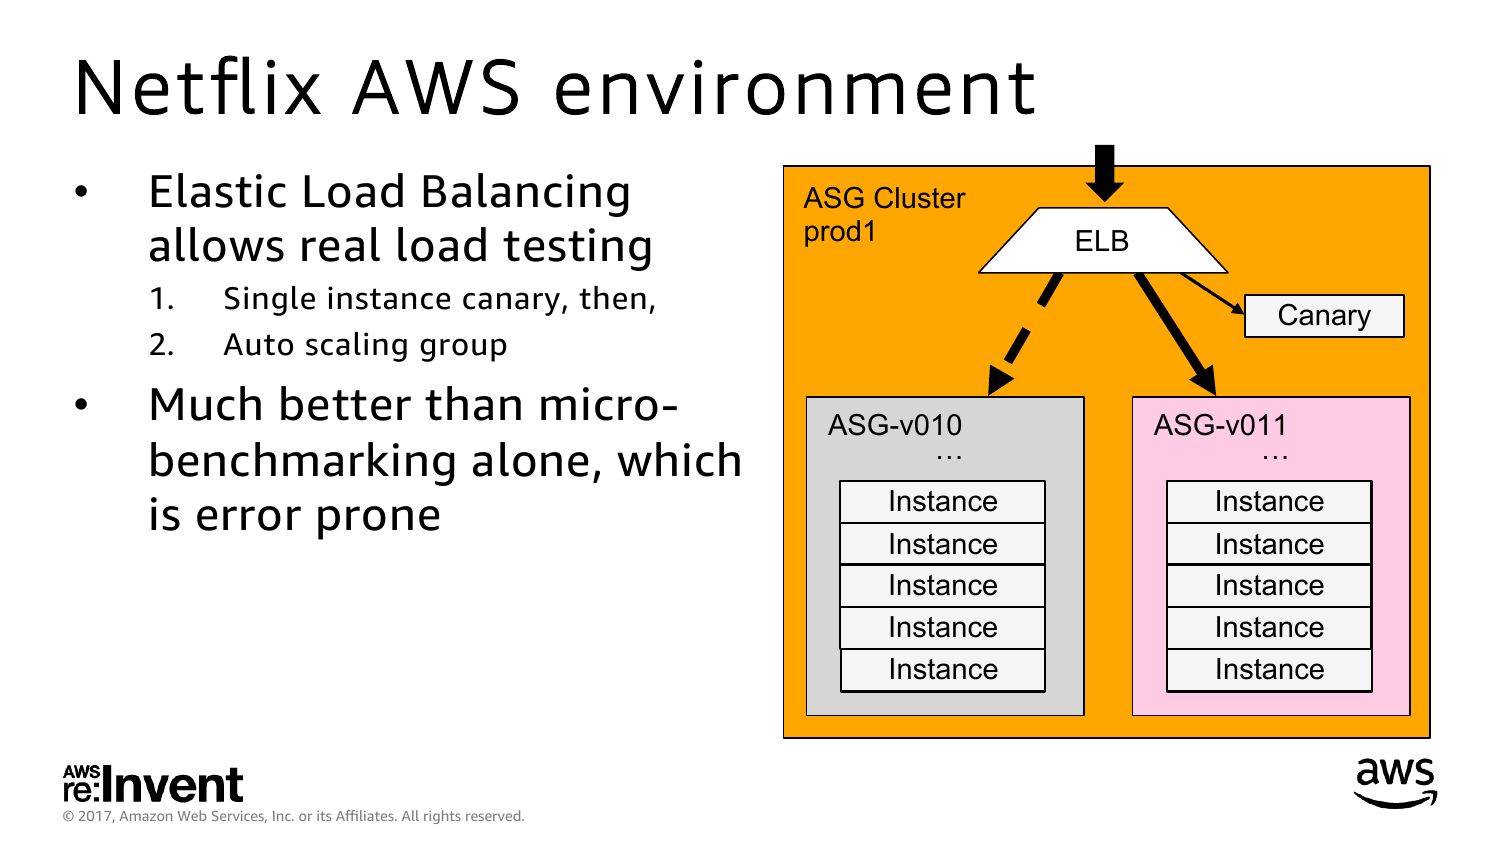
Netflix AWS environment
Elastic Load Balancing
allows real load testing
ASG Cluster
prod1
Single instance canary, then,
Auto scaling group
Much better than microbenchmarking alone, which
is error prone
© 2017, Amazon Web Services, Inc. or its Affiliates. All rights reserved.
ELB
Canary
ASG-v010
Instance
Instance
Instance
Instance
Instance
ASG-v011
Instance
Instance
Instance
Instance
Instance
slide 9:
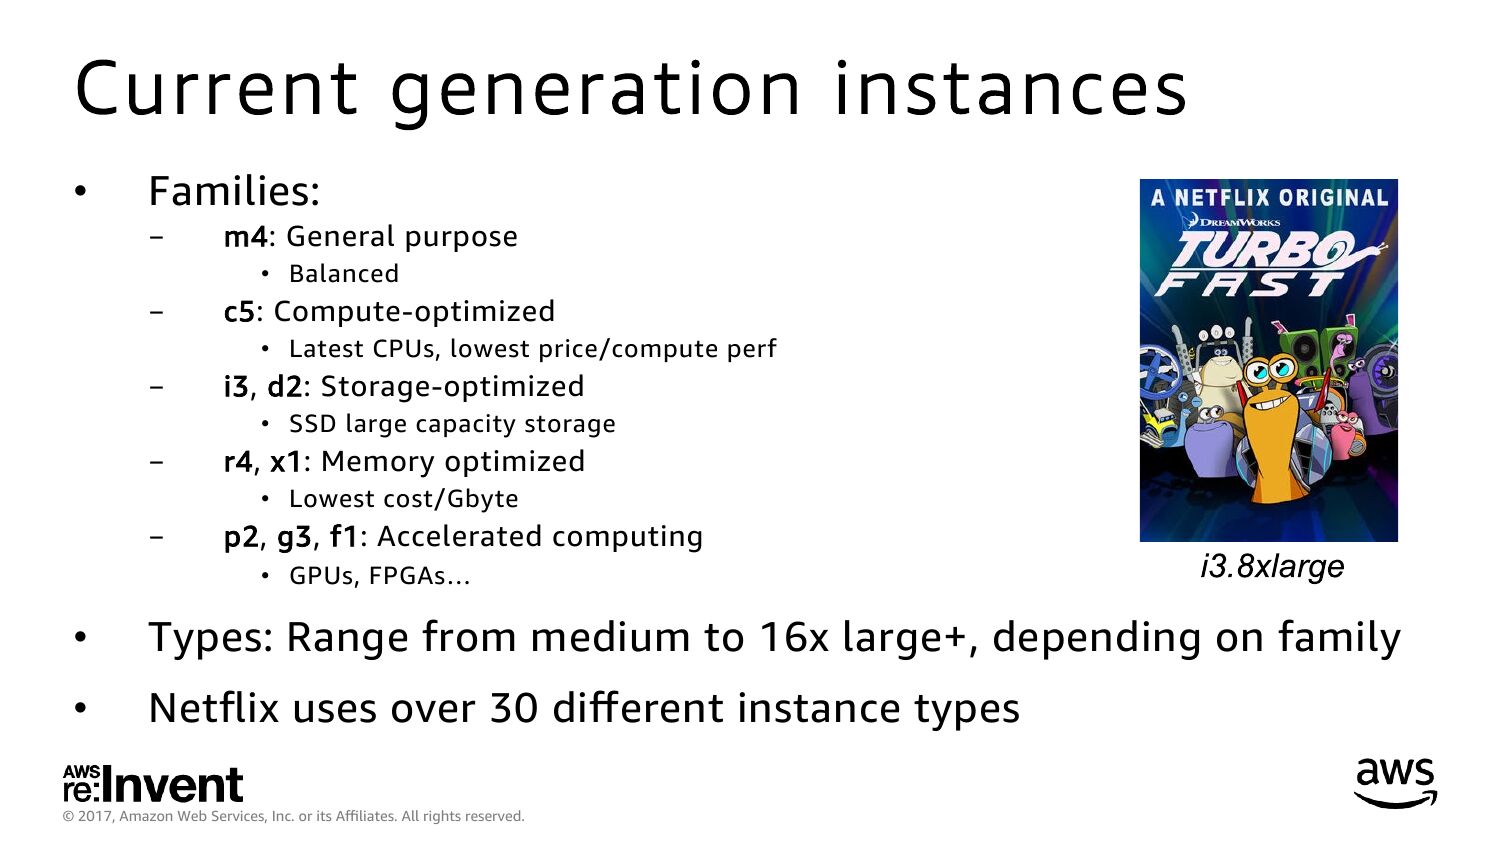
Current generation instances
Families:
m4: General purpose
• Balanced
c5: Compute-optimized
• Latest CPUs, lowest price/compute perf
i3, d2: Storage-optimized
• SSD large capacity storage
r4, x1: Memory optimized
• Lowest cost/Gbyte
p2, g3, f1: Accelerated computing
• GPUs, FPGAs…
Types: Range from medium to 16x large+, depending on family
Netflix uses over 30 different instance types
© 2017, Amazon Web Services, Inc. or its Affiliates. All rights reserved.
slide 10:
Netflix instance type selection
A. Flow chart
B. By-resource
C. Brute force
© 2017, Amazon Web Services, Inc. or its Affiliates. All rights reserved.
slide 11:
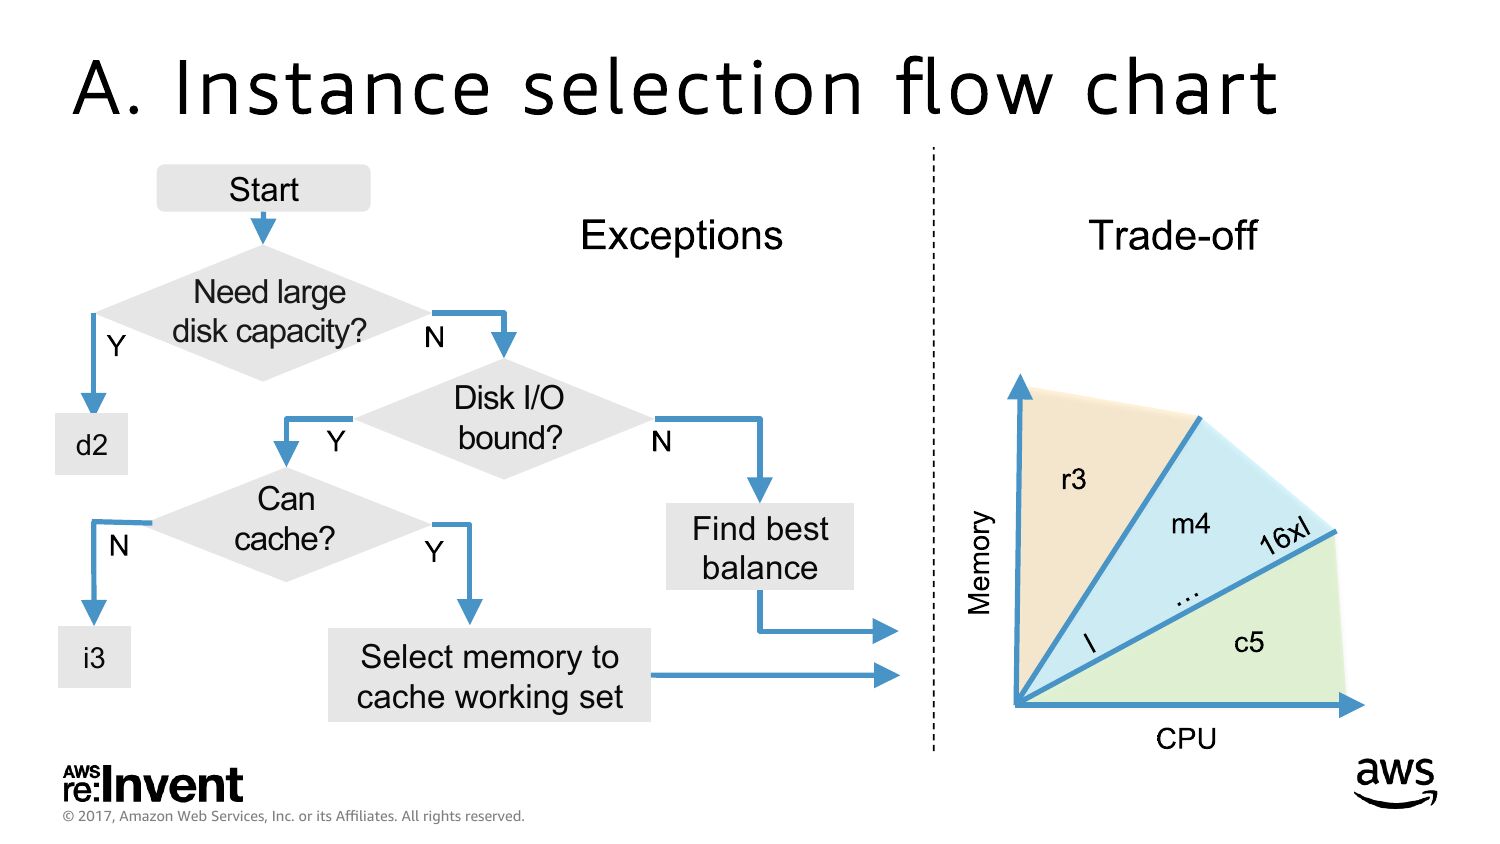
A. Instance selection flow chart
Start
Need large
disk capacity?
Disk I/O
bound?
Can
cache?
Find best
balance
Select memory to
cache working set
© 2017, Amazon Web Services, Inc. or its Affiliates. All rights reserved.
slide 12:
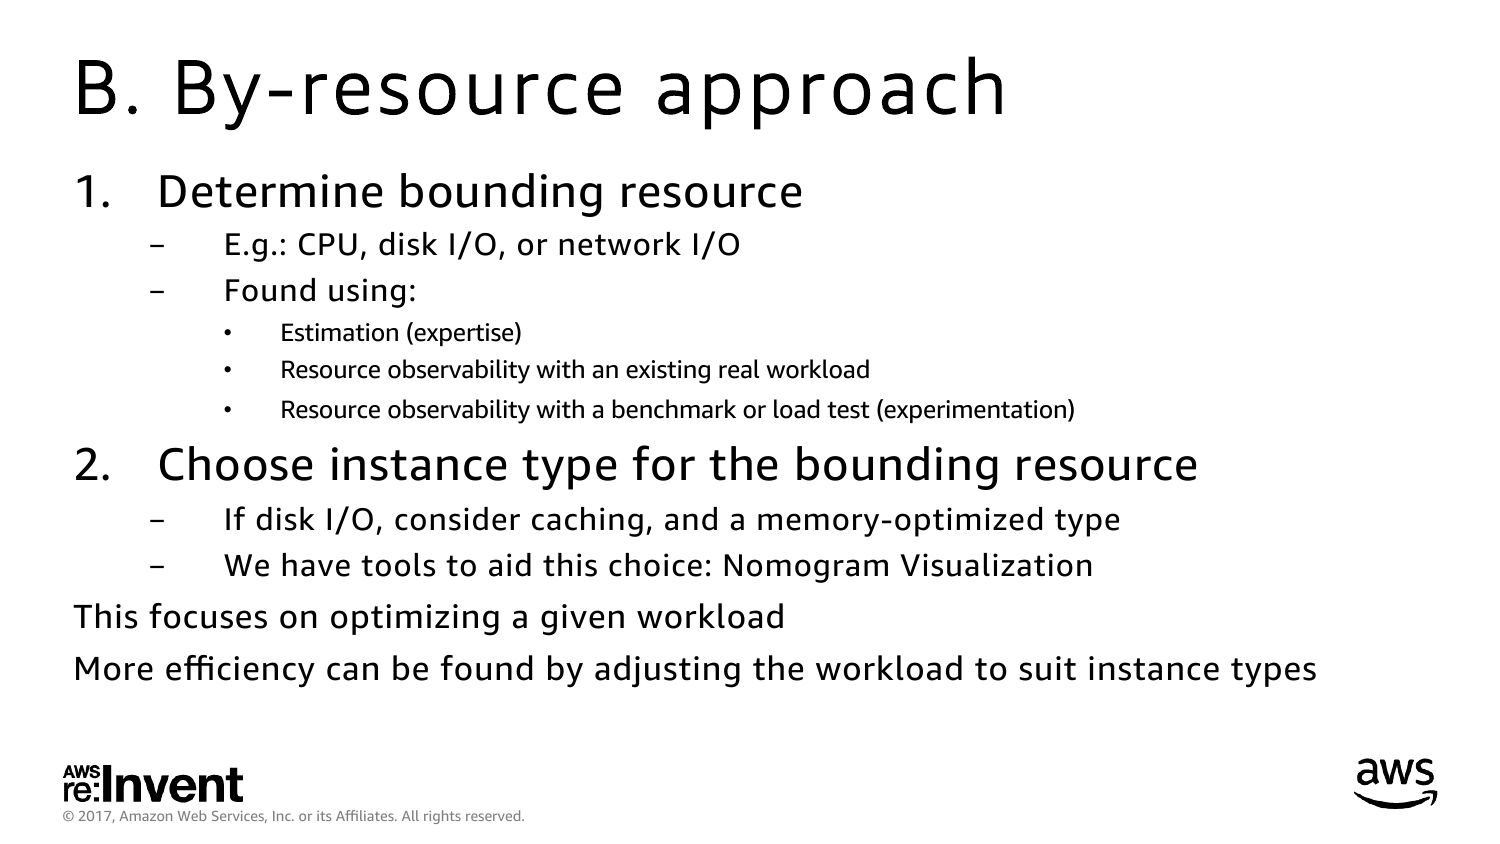
B. By-resource approach
Determine bounding resource
E.g.: CPU, disk I/O, or network I/O
Found using:
Estimation (expertise)
Resource observability with an existing real workload
Resource observability with a benchmark or load test (experimentation)
Choose instance type for the bounding resource
If disk I/O, consider caching, and a memory-optimized type
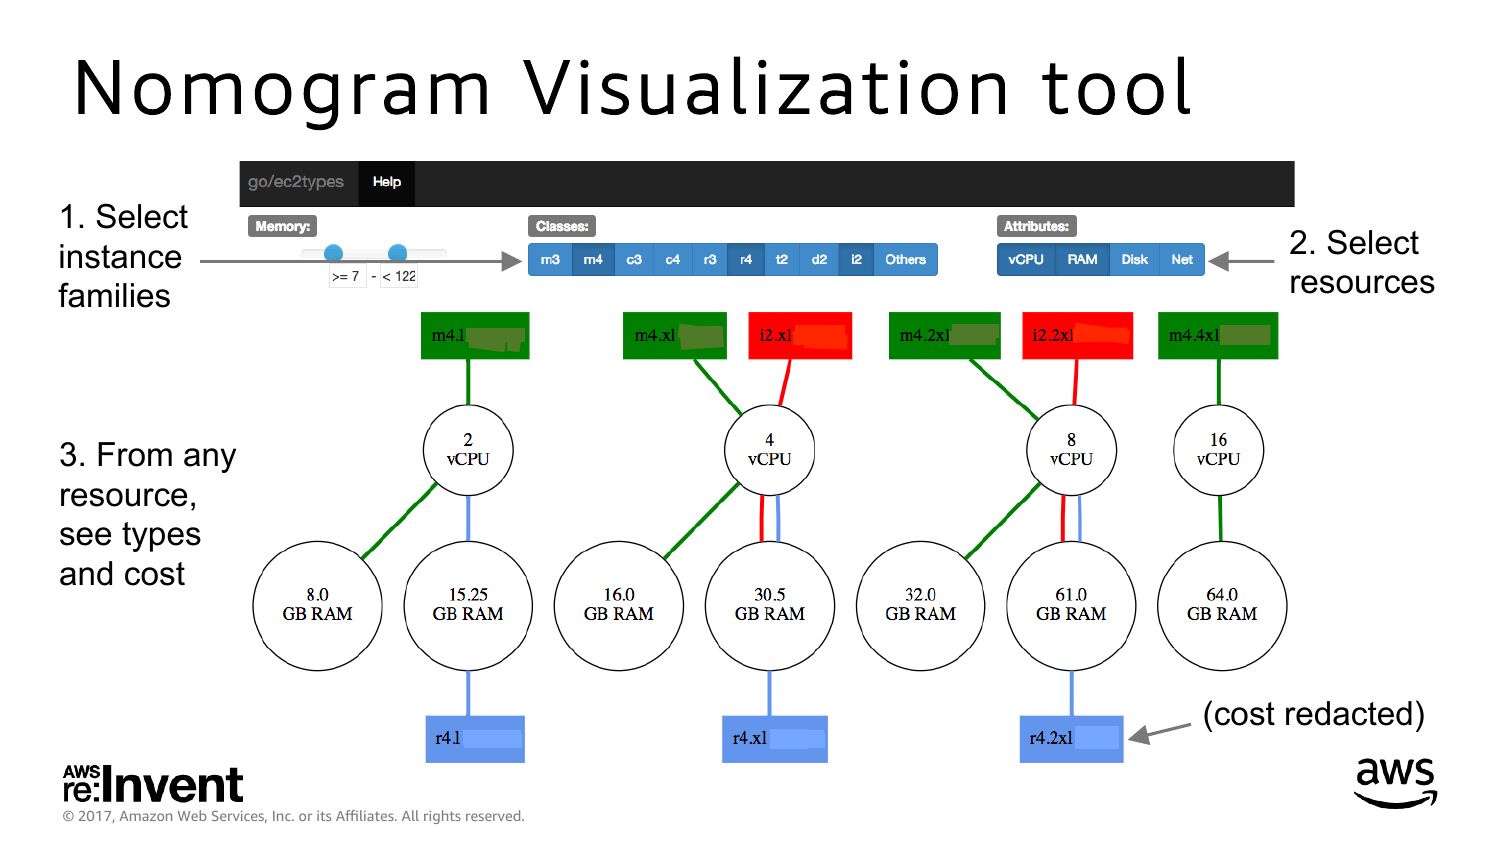
We have tools to aid this choice: Nomogram Visualization
This focuses on optimizing a given workload
More efficiency can be found by adjusting the workload to suit instance types
© 2017, Amazon Web Services, Inc. or its Affiliates. All rights reserved.
slide 13:
Nomogram Visualization tool
1. Select
instance
families
2. Select
resources
3. From any
resource,
see types
and cost
(cost redacted)
© 2017, Amazon Web Services, Inc. or its Affiliates. All rights reserved.
slide 14:
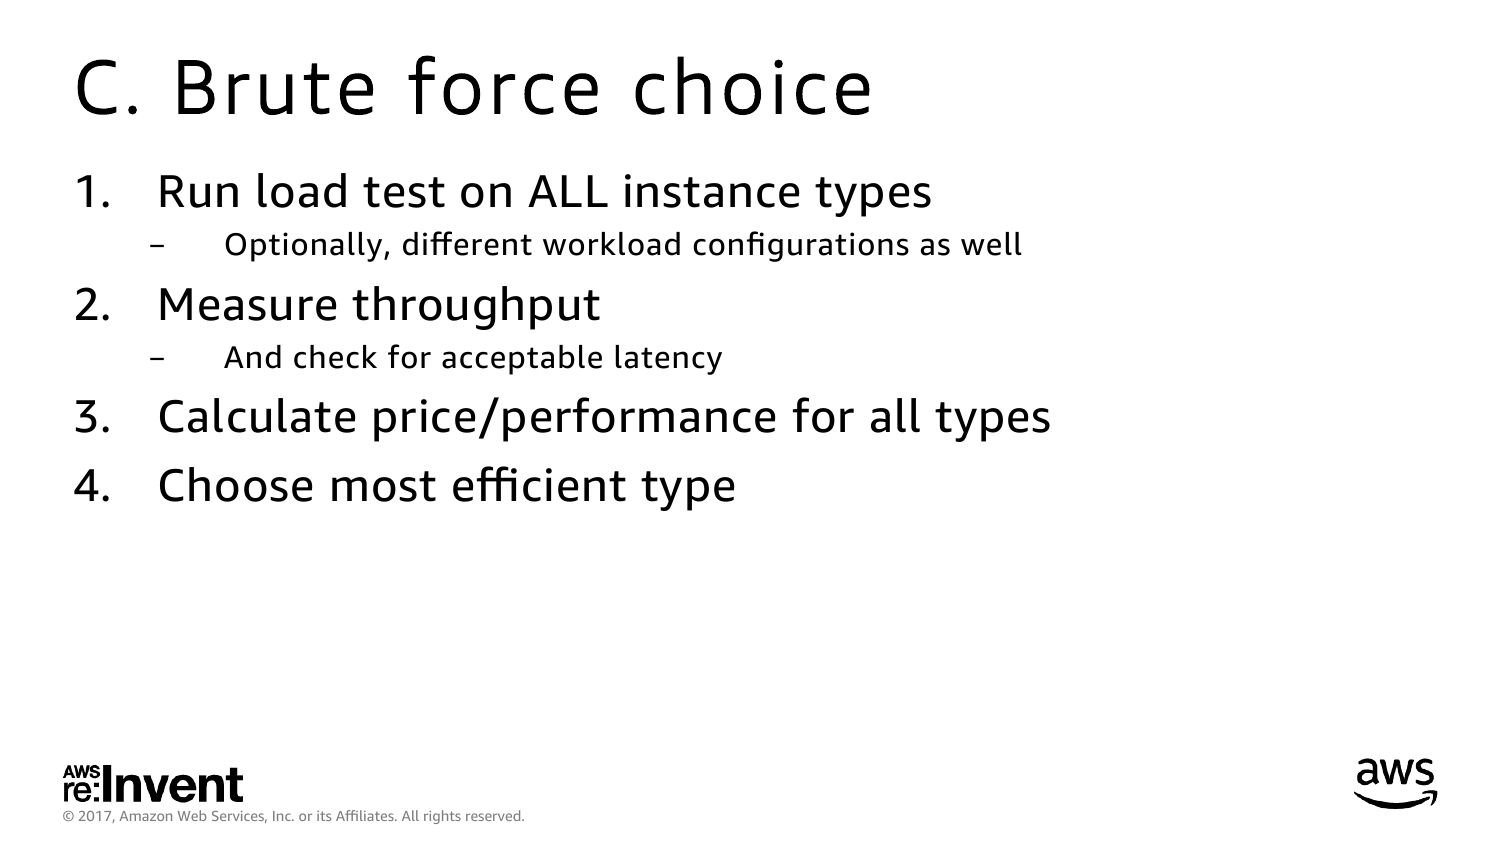
C. Brute force choice
Run load test on ALL instance types
Measure throughput
Optionally, different workload configurations as well
And check for acceptable latency
Calculate price/performance for all types
Choose most efficient type
© 2017, Amazon Web Services, Inc. or its Affiliates. All rights reserved.
slide 15:
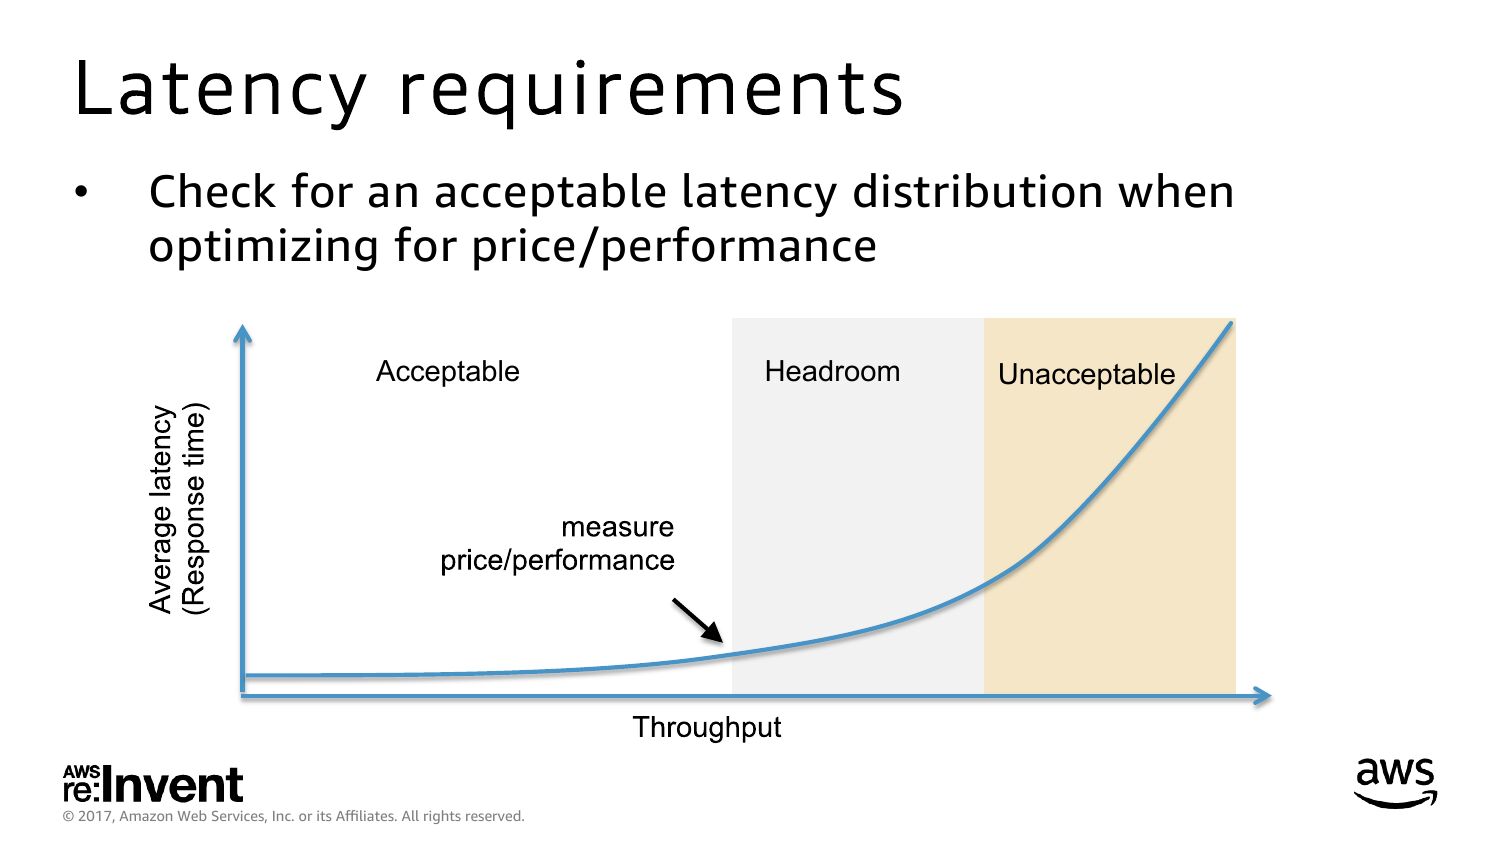
Latency requirements
Check for an acceptable latency distribution when
optimizing for price/performance
Acceptable
© 2017, Amazon Web Services, Inc. or its Affiliates. All rights reserved.
Headroom
Unacceptable
slide 16:
Netflix instance type re-selection
A. Usage
B. Cost
C. Variance
© 2017, Amazon Web Services, Inc. or its Affiliates. All rights reserved.
slide 17:
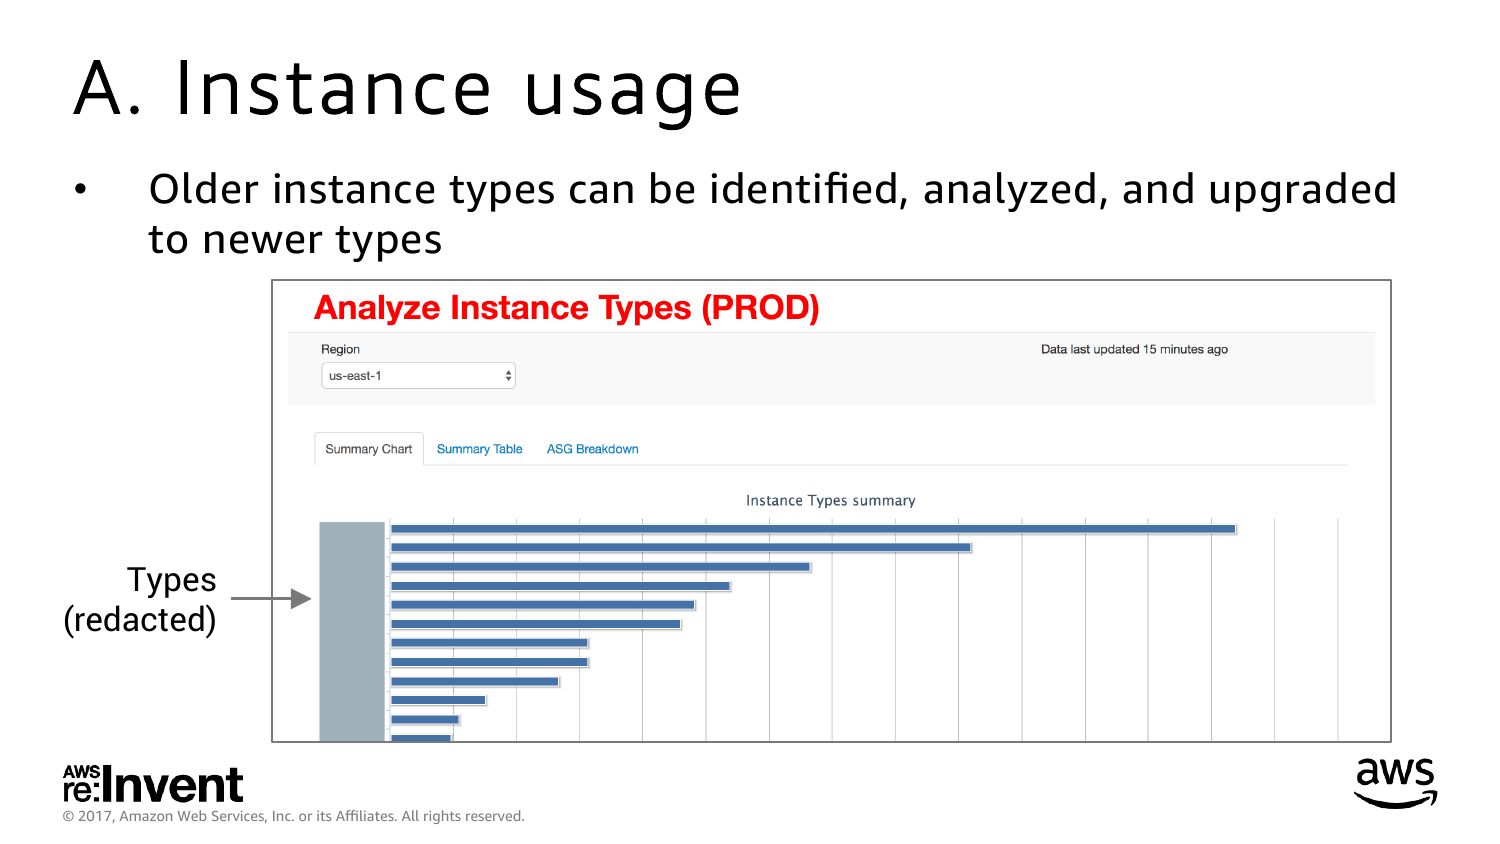
A. Instance usage
Older instance types can be identified, analyzed, and upgraded
to newer types
Types
(redacted)
© 2017, Amazon Web Services, Inc. or its Affiliates. All rights reserved.
slide 18:
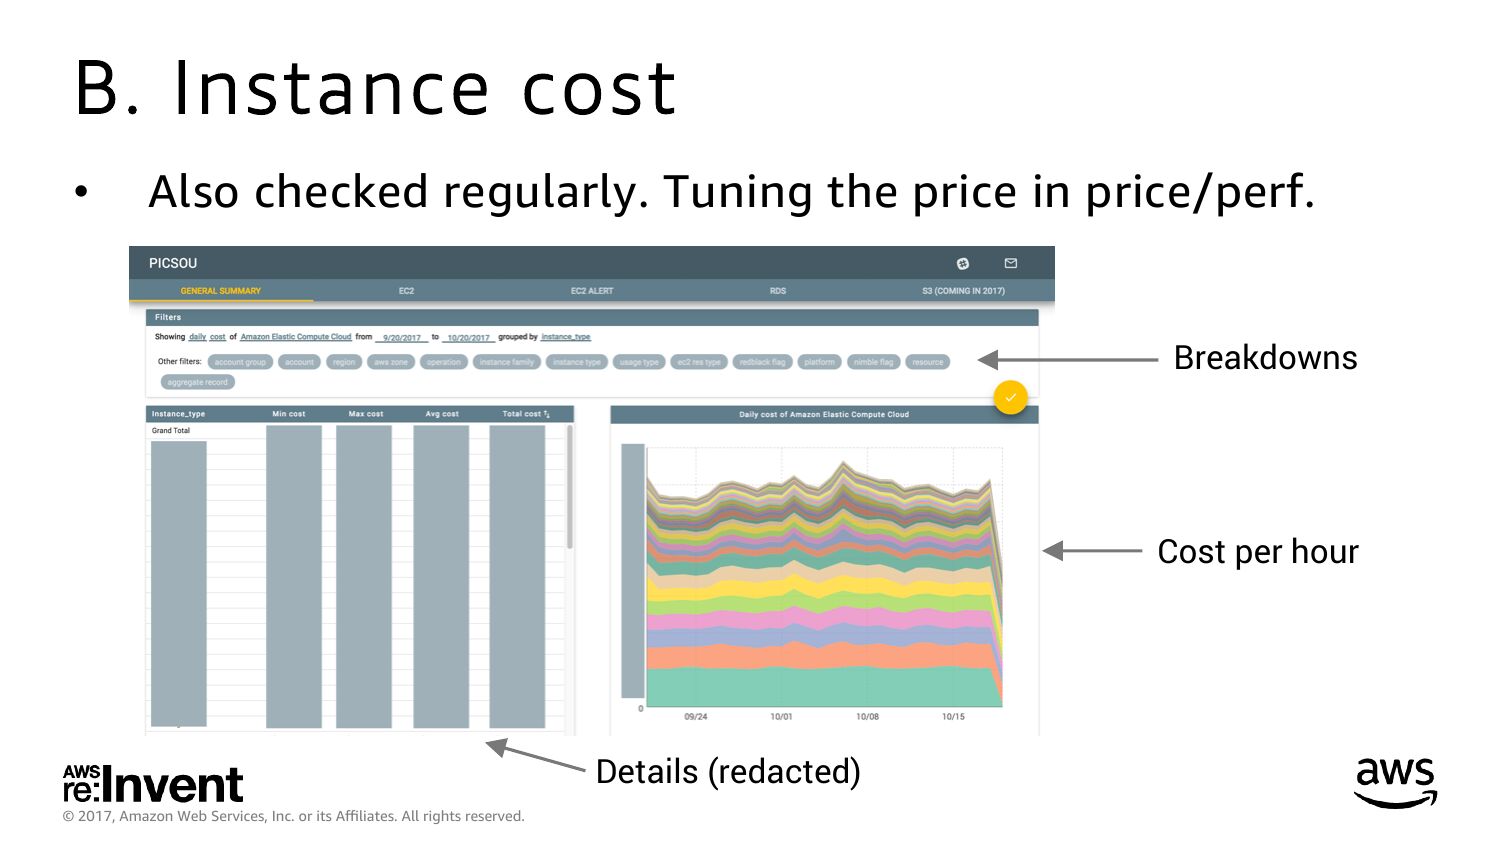
B. Instance cost
Also checked regularly. Tuning the price in price/perf.
Breakdowns
Cost per hour
Details (redacted)
© 2017, Amazon Web Services, Inc. or its Affiliates. All rights reserved.
slide 19:
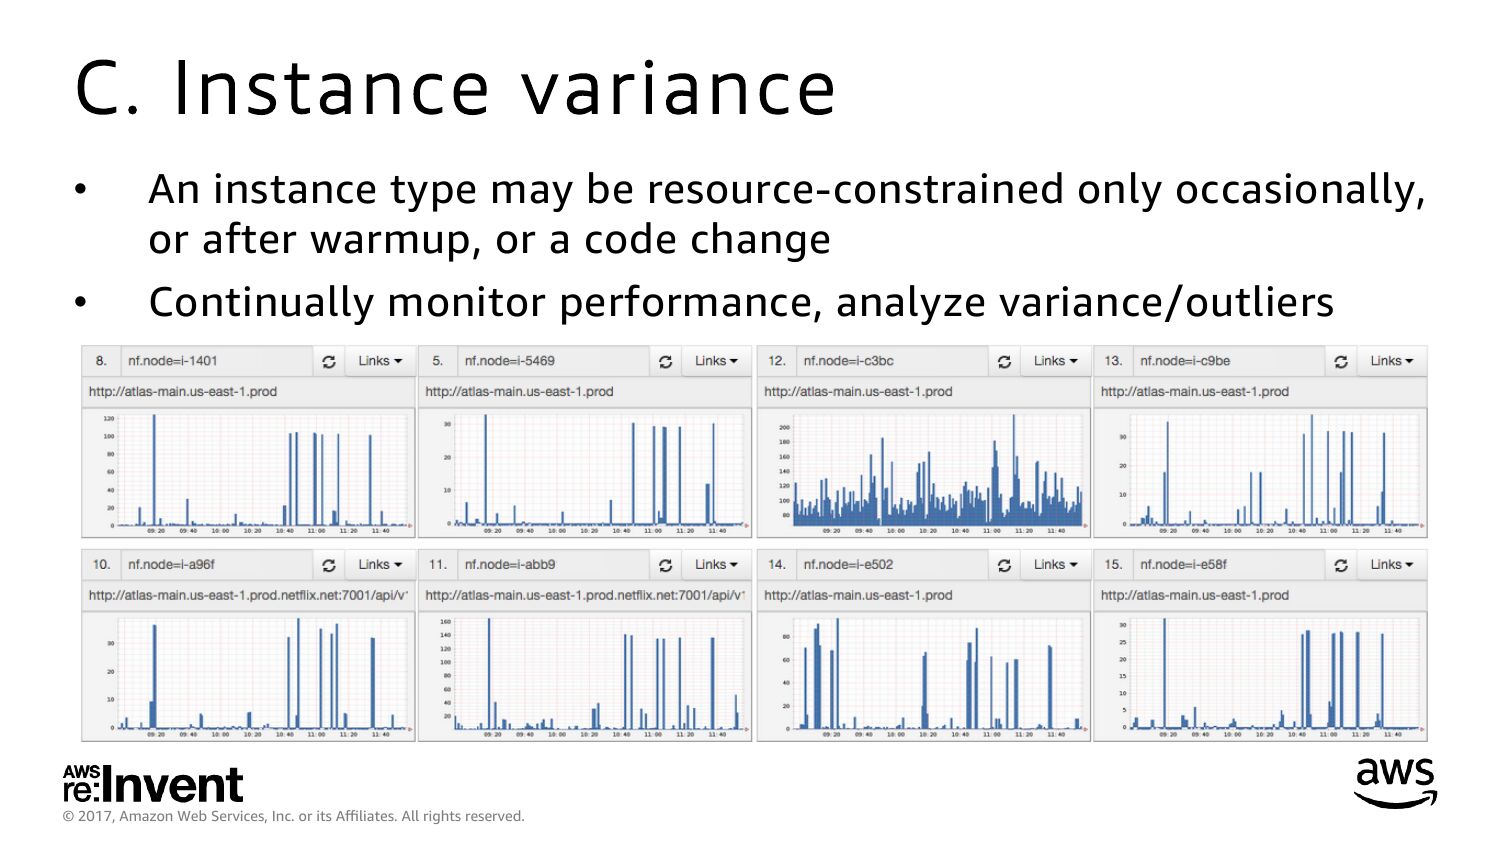
C. Instance variance
An instance type may be resource-constrained only occasionally,
or after warmup, or a code change
Continually monitor performance, analyze variance/outliers
© 2017, Amazon Web Services, Inc. or its Affiliates. All rights reserved.
slide 20:
2. Amazon EC2 features
© 2017, Amazon Web Services, Inc. or its Affiliates. All rights reserved.
slide 21:
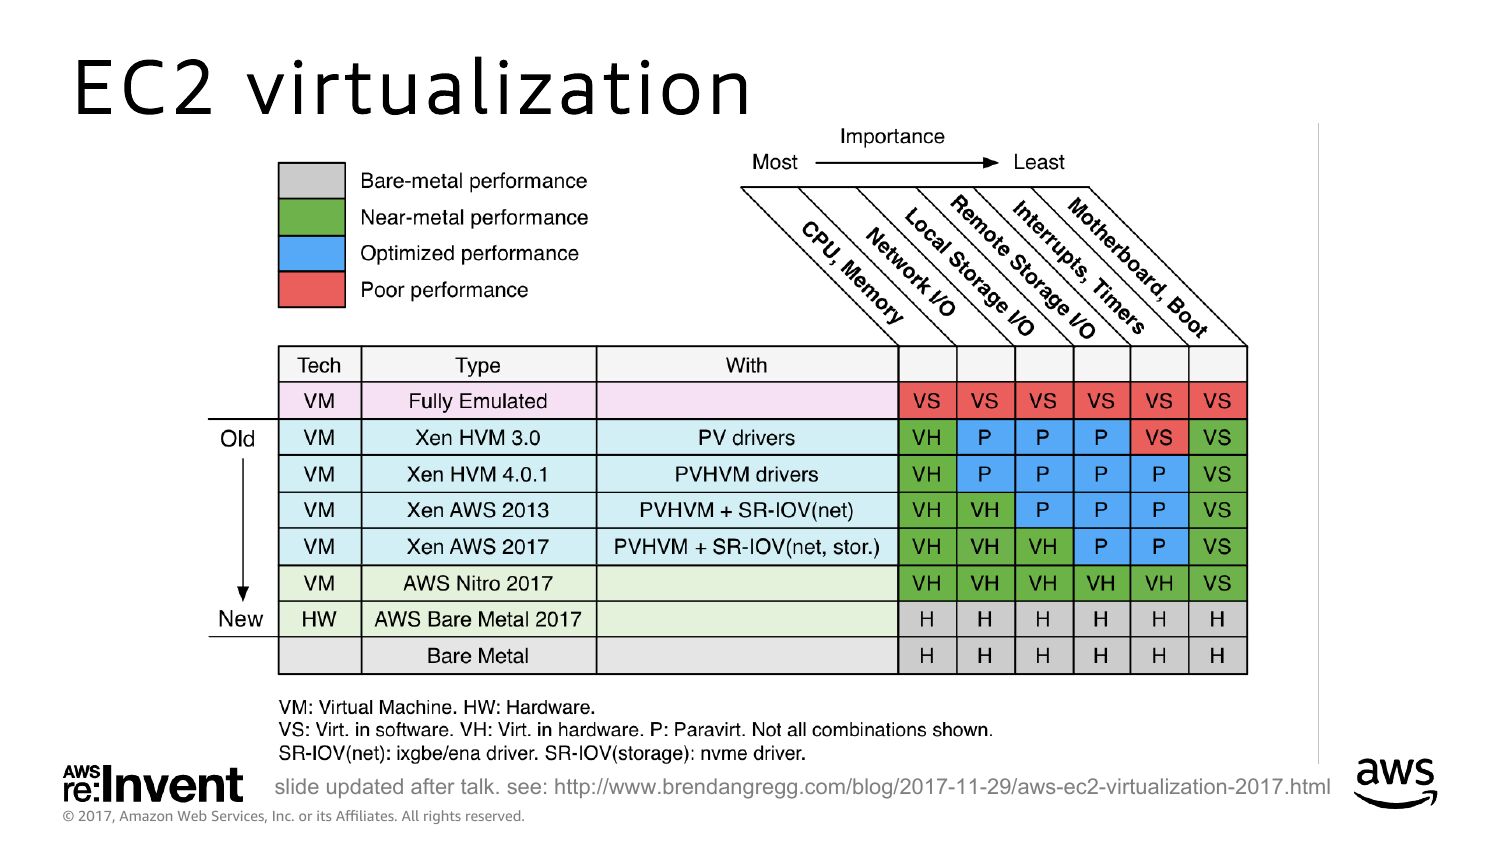
EC2 virtualization
slide updated after talk. see: http://www.brendangregg.com/blog/2017-11-29/aws-ec2-virtualization-2017.html
© 2017, Amazon Web Services, Inc. or its Affiliates. All rights reserved.
slide 22:
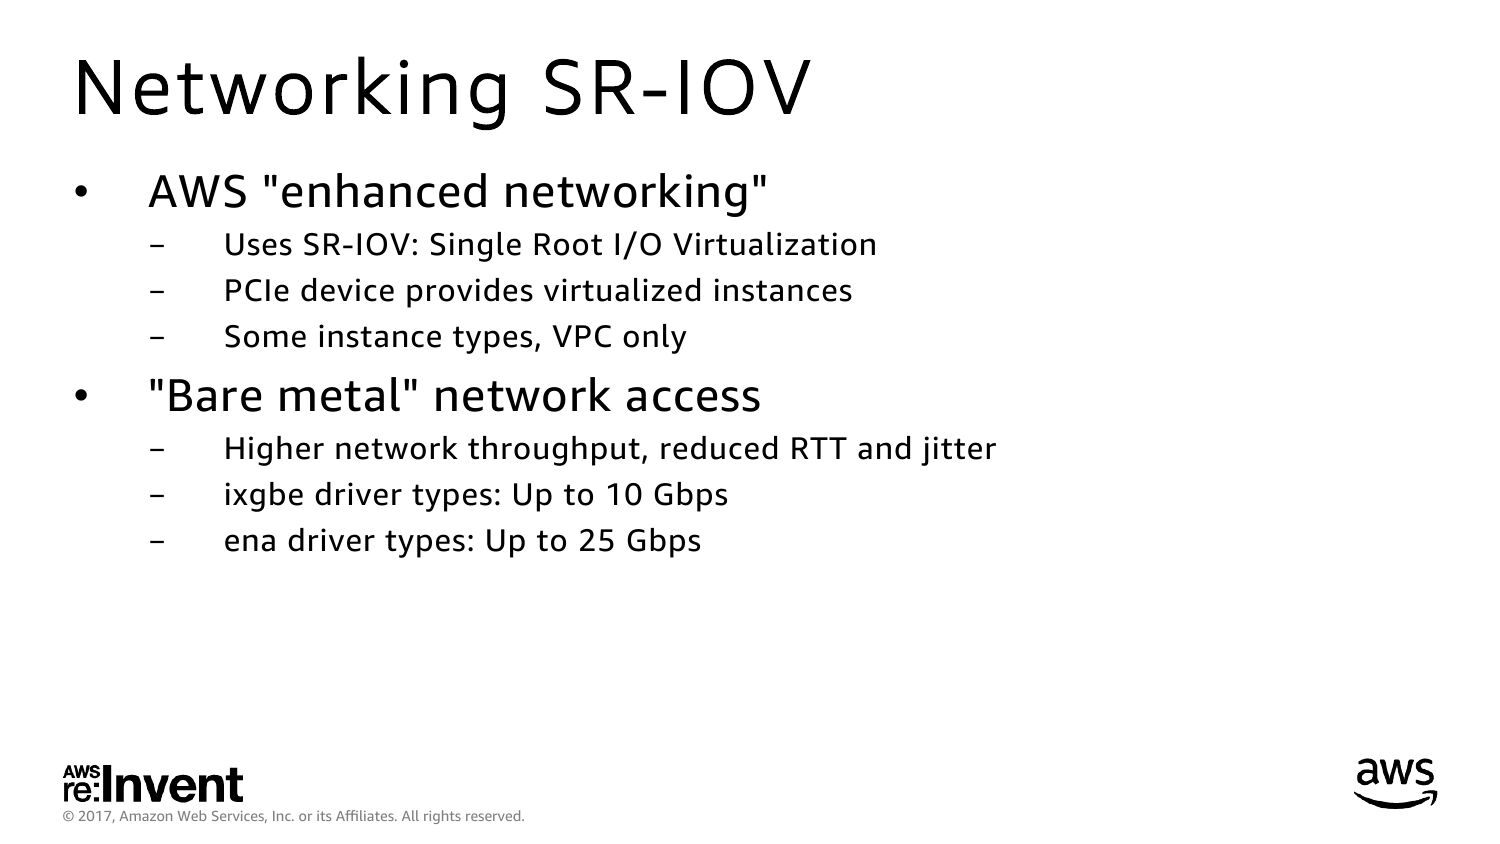
Networking SR-IOV
AWS "enhanced networking"
Uses SR-IOV: Single Root I/O Virtualization
PCIe device provides virtualized instances
Some instance types, VPC only
"Bare metal" network access
Higher network throughput, reduced RTT and jitter
ixgbe driver types: Up to 10 Gbps
ena driver types: Up to 25 Gbps
© 2017, Amazon Web Services, Inc. or its Affiliates. All rights reserved.
slide 23:
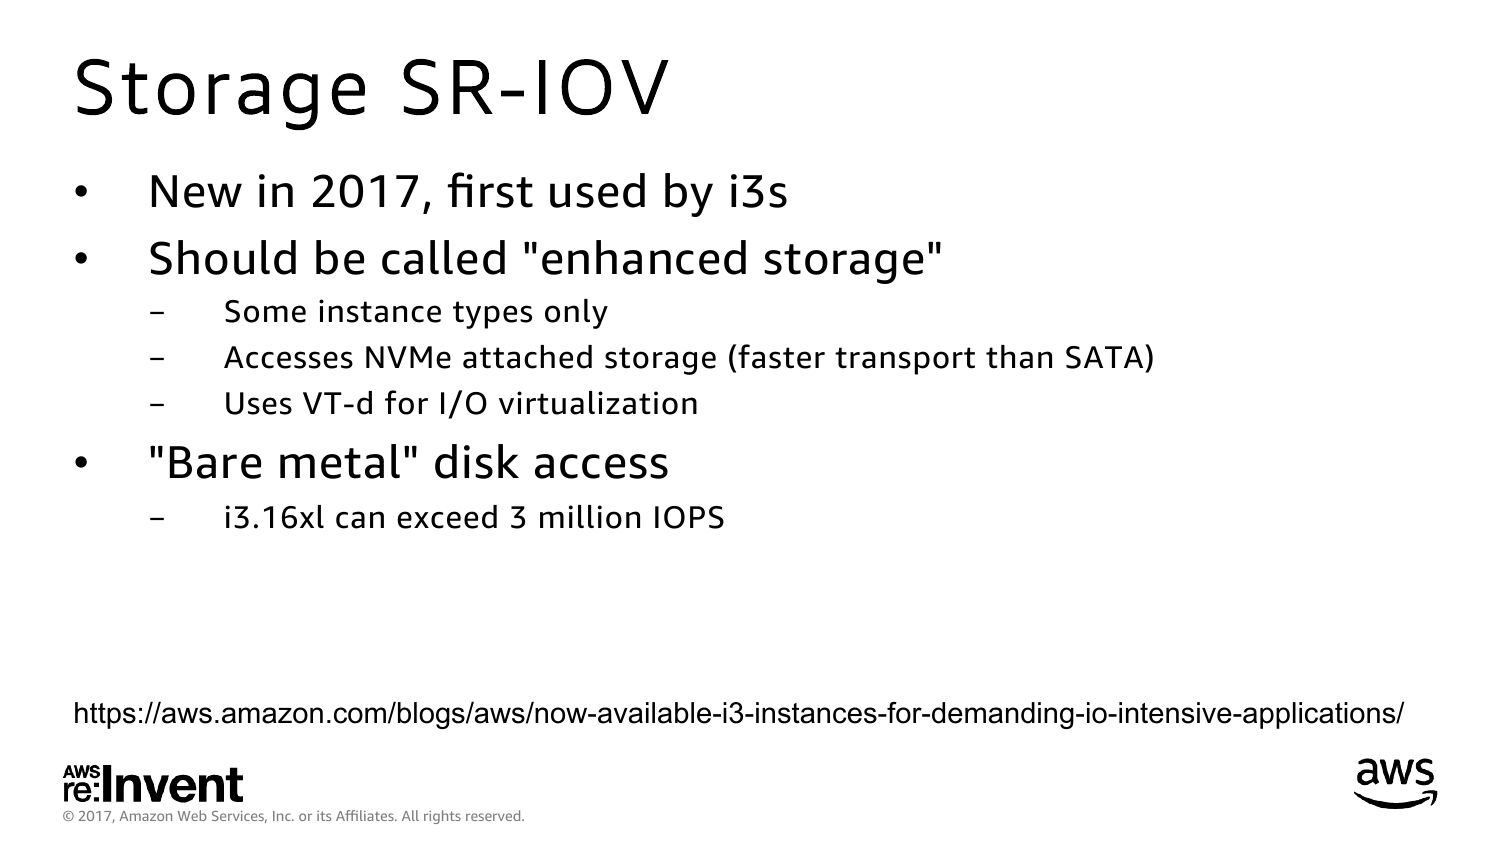
Storage SR-IOV
New in 2017, first used by i3s
Should be called "enhanced storage"
Some instance types only
Accesses NVMe attached storage (faster transport than SATA)
Uses VT-d for I/O virtualization
"Bare metal" disk access
i3.16xl can exceed 3 million IOPS
https://aws.amazon.com/blogs/aws/now-available-i3-instances-for-demanding-io-intensive-applications/
© 2017, Amazon Web Services, Inc. or its Affiliates. All rights reserved.
slide 24:
3. Kernel tuning
© 2017, Amazon Web Services, Inc. or its Affiliates. All rights reserved.
slide 25:
Kernel tuning
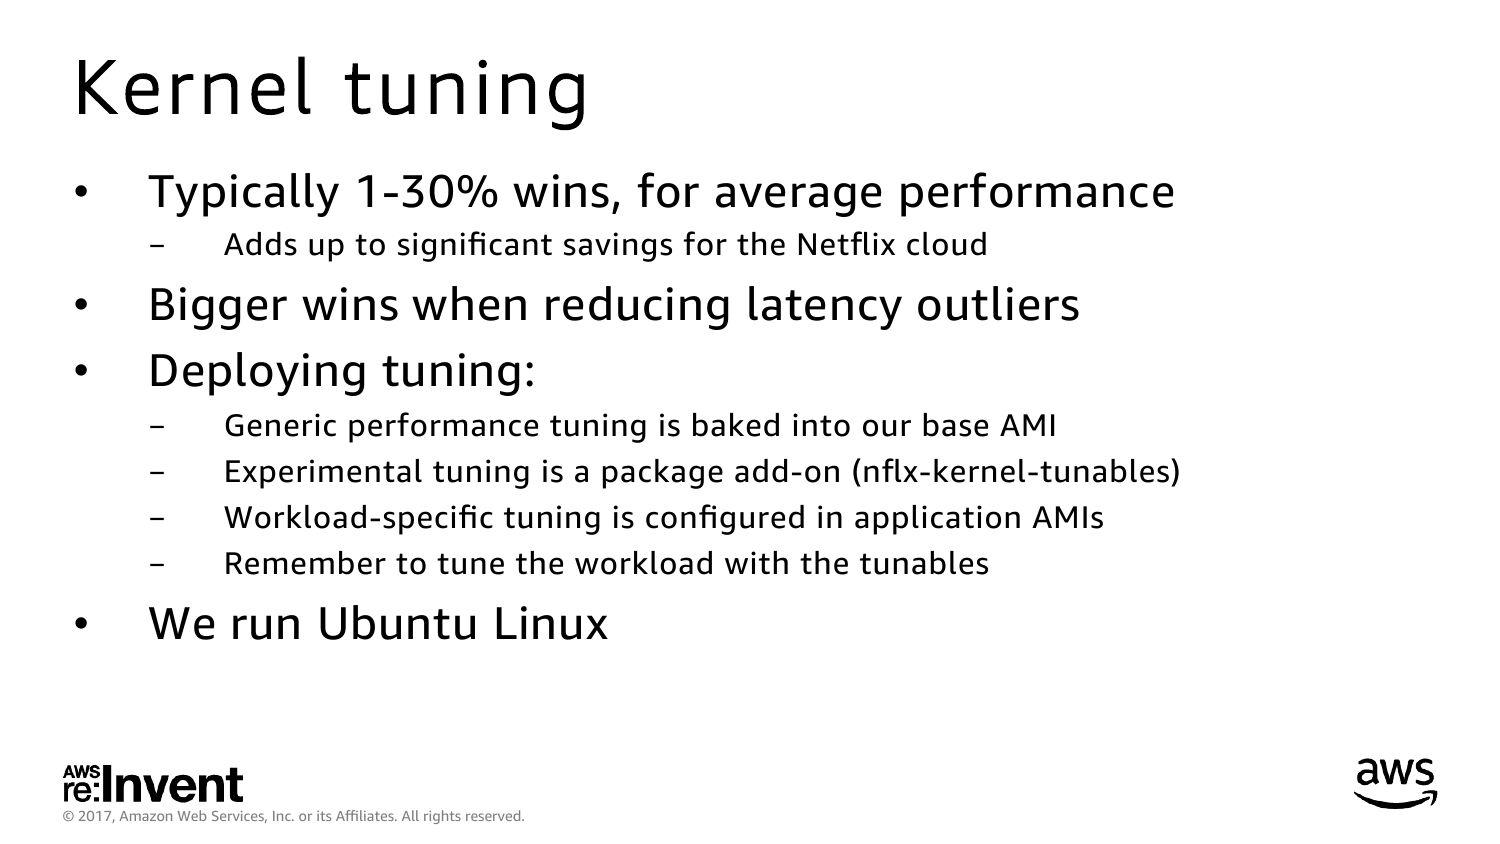
Typically 1-30% wins, for average performance
Bigger wins when reducing latency outliers
Deploying tuning:
Adds up to significant savings for the Netflix cloud
Generic performance tuning is baked into our base AMI
Experimental tuning is a package add-on (nflx-kernel-tunables)
Workload-specific tuning is configured in application AMIs
Remember to tune the workload with the tunables
We run Ubuntu Linux
© 2017, Amazon Web Services, Inc. or its Affiliates. All rights reserved.
slide 26:
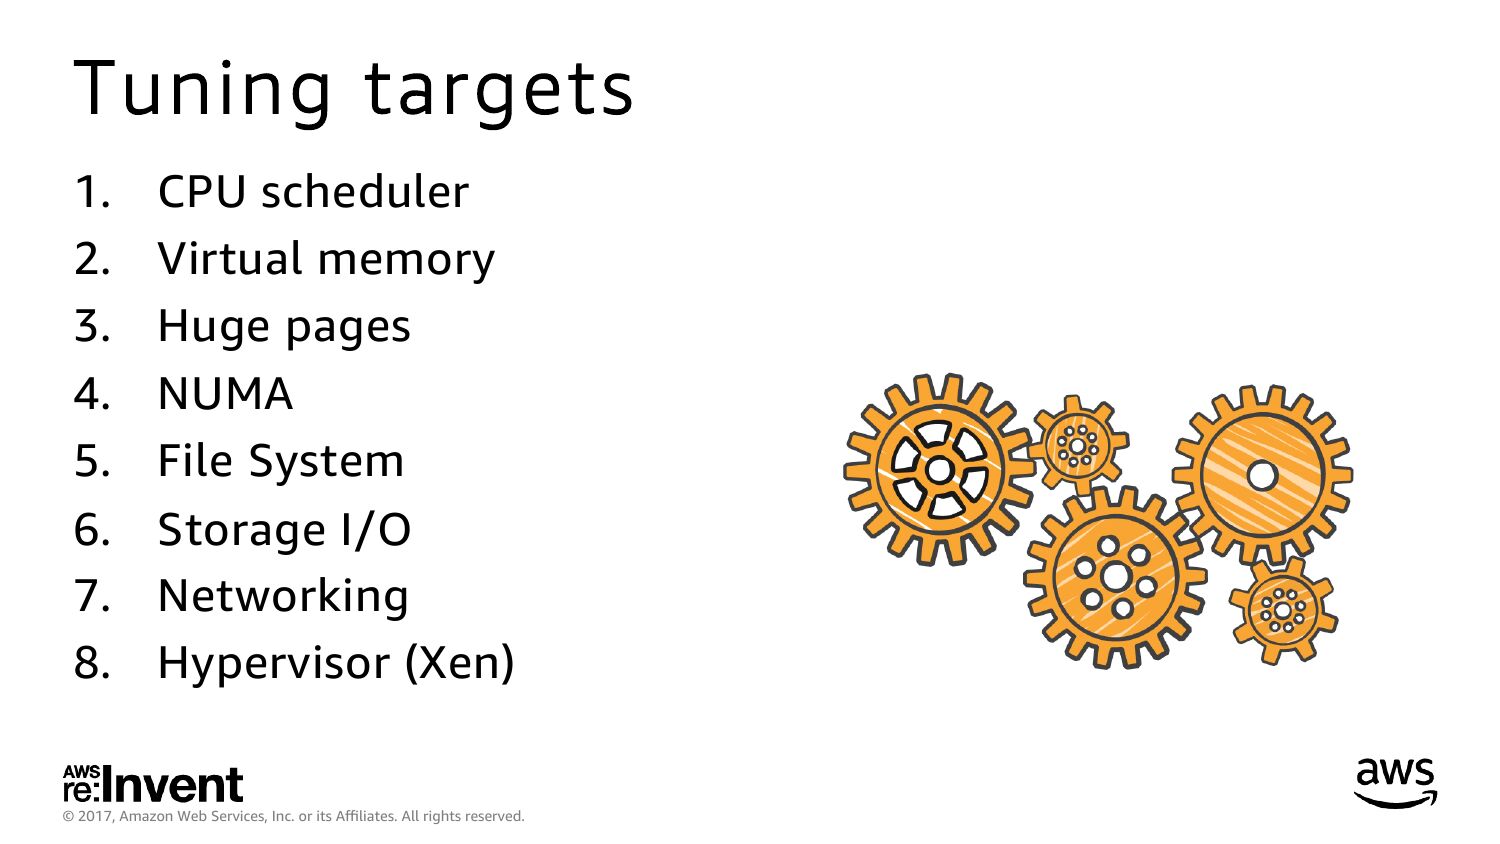
Tuning targets
CPU scheduler
Virtual memory
Huge pages
NUMA
File System
Storage I/O
Networking
Hypervisor (Xen)
© 2017, Amazon Web Services, Inc. or its Affiliates. All rights reserved.
slide 27:
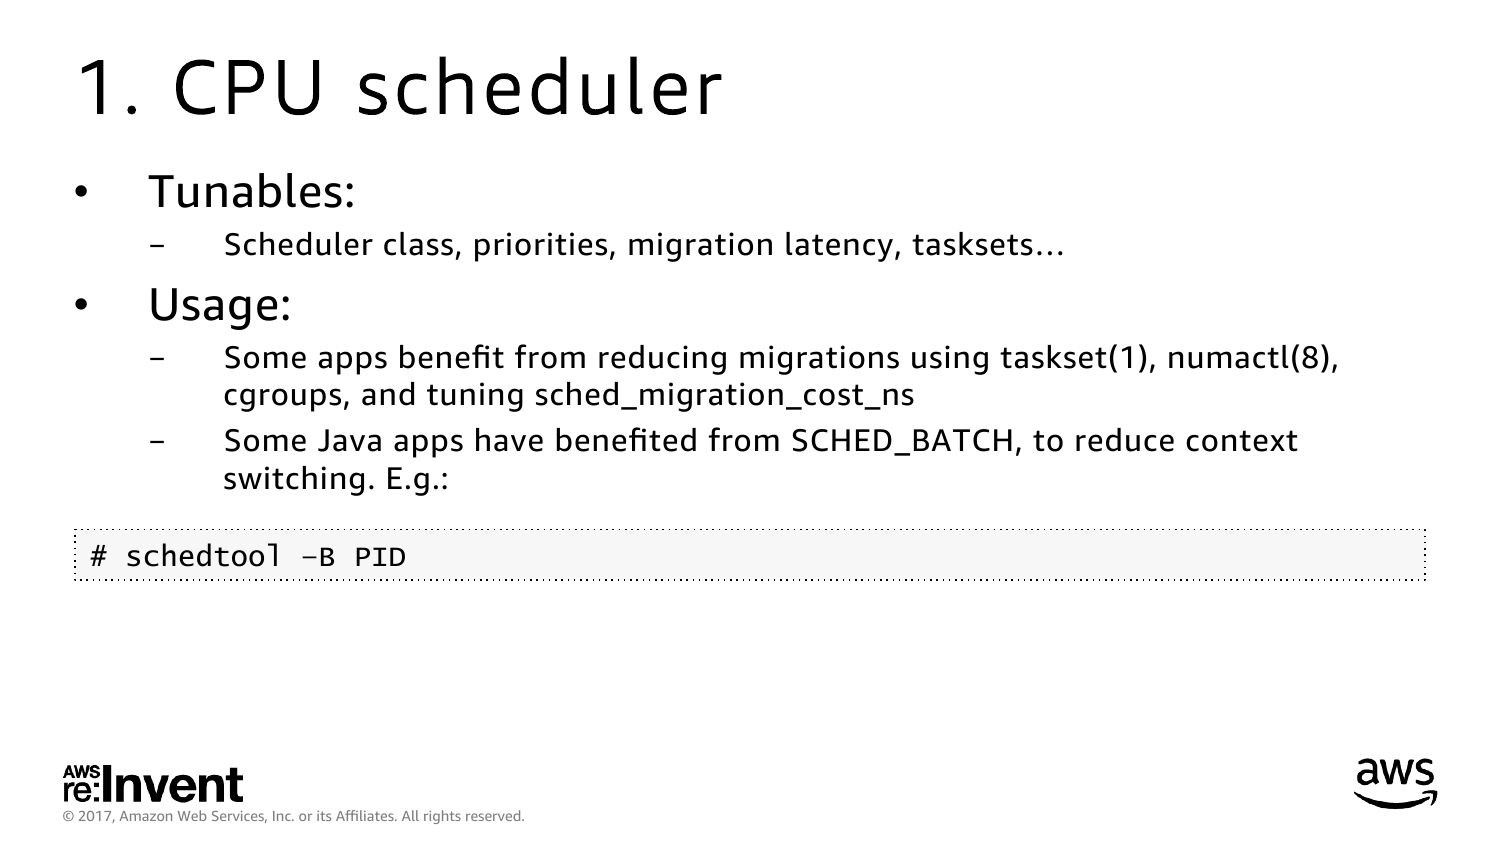
1. CPU scheduler
Tunables:
Scheduler class, priorities, migration latency, tasksets…
Usage:
Some apps benefit from reducing migrations using taskset(1), numactl(8),
cgroups, and tuning sched_migration_cost_ns
Some Java apps have benefited from SCHED_BATCH, to reduce context
switching. E.g.:
# schedtool –B PID
© 2017, Amazon Web Services, Inc. or its Affiliates. All rights reserved.
slide 28:
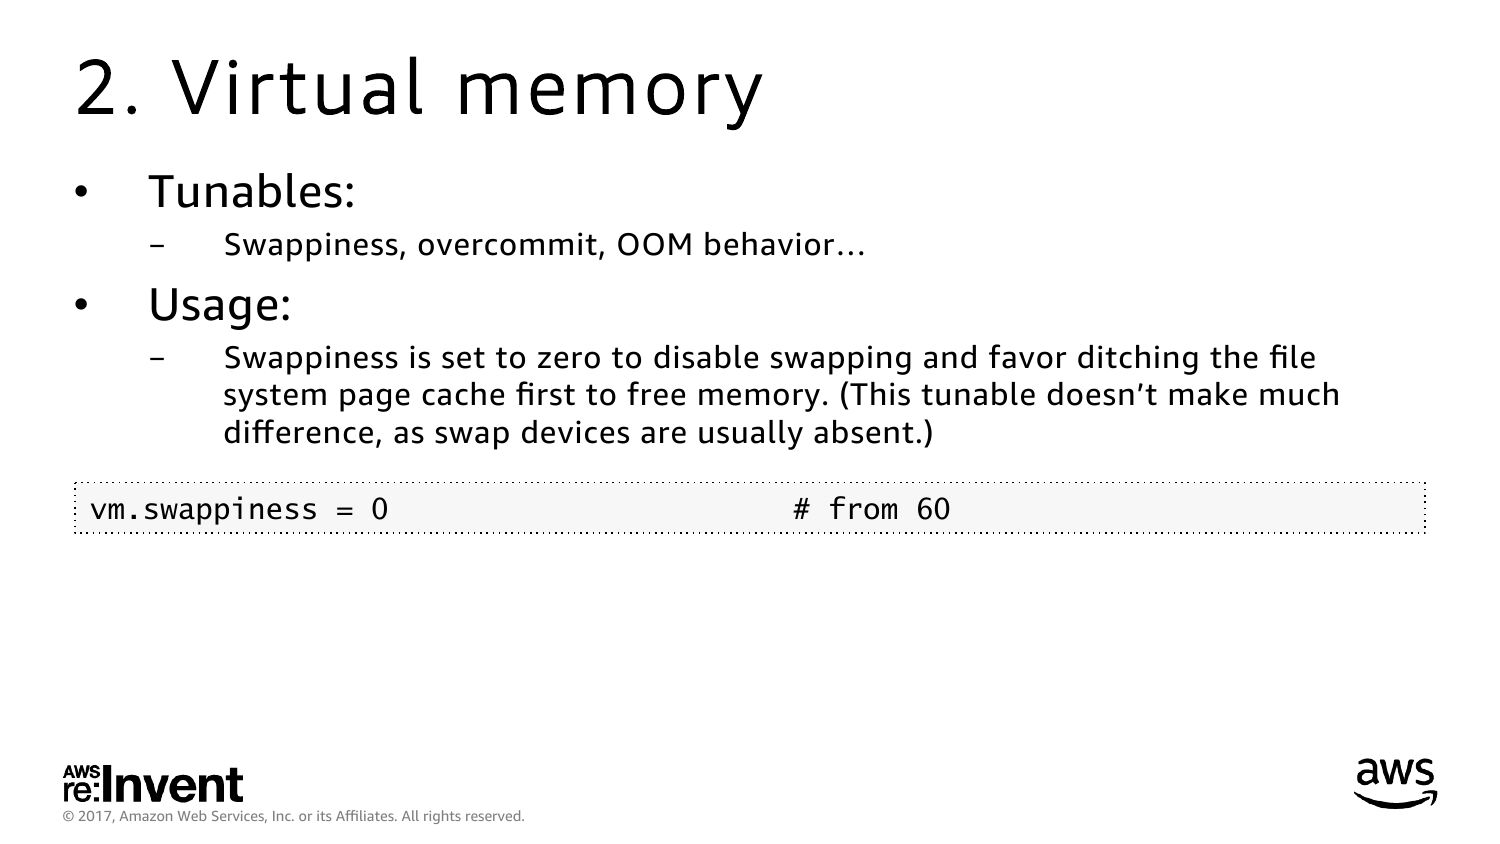
2. Virtual memory
Tunables:
Swappiness, overcommit, OOM behavior…
Usage:
Swappiness is set to zero to disable swapping and favor ditching the file
system page cache first to free memory. (This tunable doesn’t make much
difference, as swap devices are usually absent.)
vm.swappiness = 0
© 2017, Amazon Web Services, Inc. or its Affiliates. All rights reserved.
# from 60
slide 29:
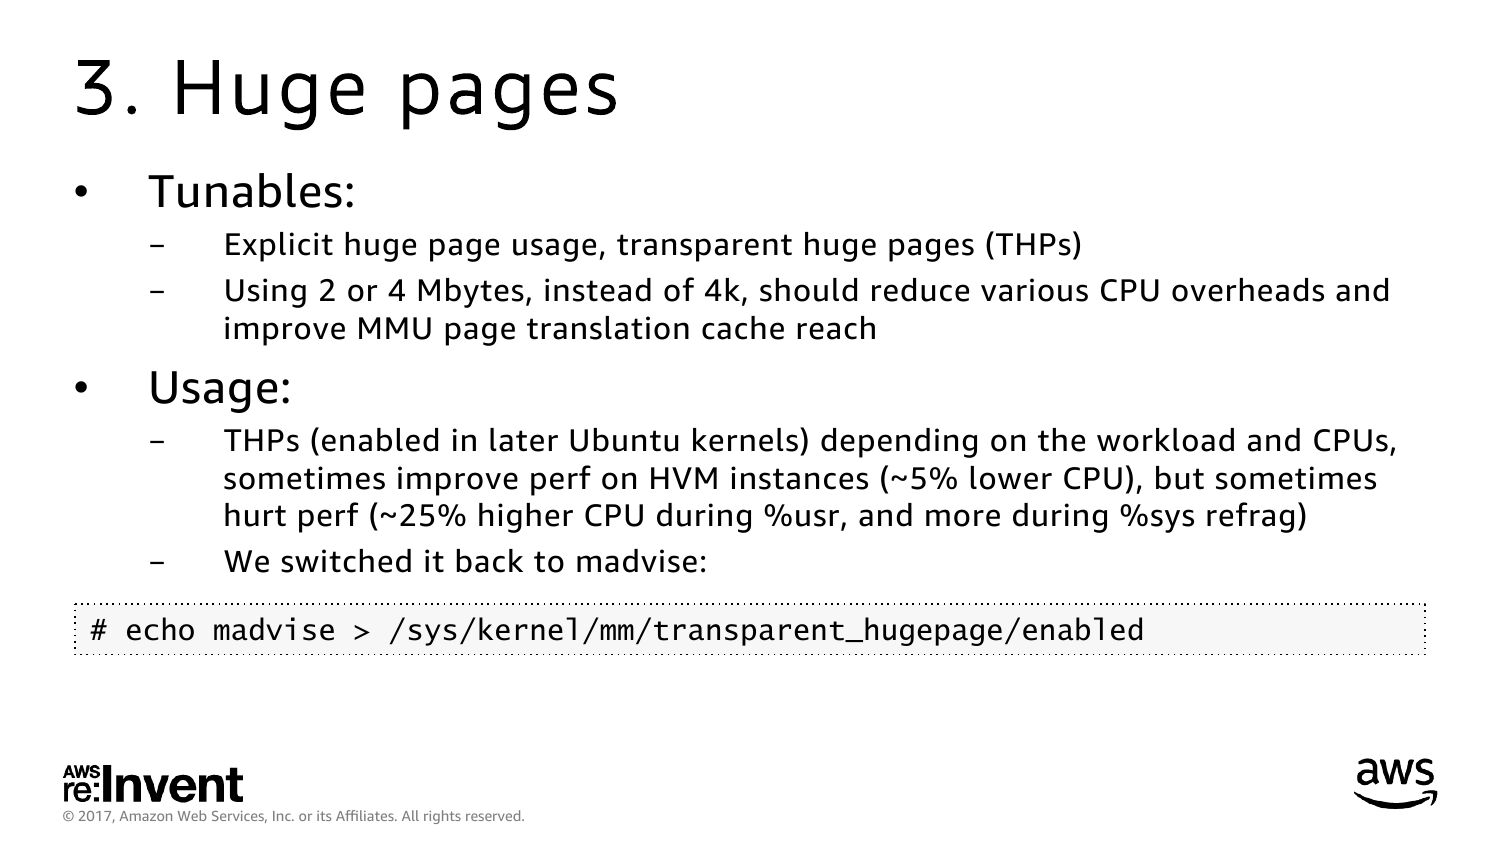
3. Huge pages
Tunables:
Explicit huge page usage, transparent huge pages (THPs)
Using 2 or 4 Mbytes, instead of 4k, should reduce various CPU overheads and
improve MMU page translation cache reach
Usage:
THPs (enabled in later Ubuntu kernels) depending on the workload and CPUs,
sometimes improve perf on HVM instances (~5% lower CPU), but sometimes
hurt perf (~25% higher CPU during %usr, and more during %sys refrag)
We switched it back to madvise:
# echo madvise >gt; /sys/kernel/mm/transparent_hugepage/enabled
© 2017, Amazon Web Services, Inc. or its Affiliates. All rights reserved.
slide 30:
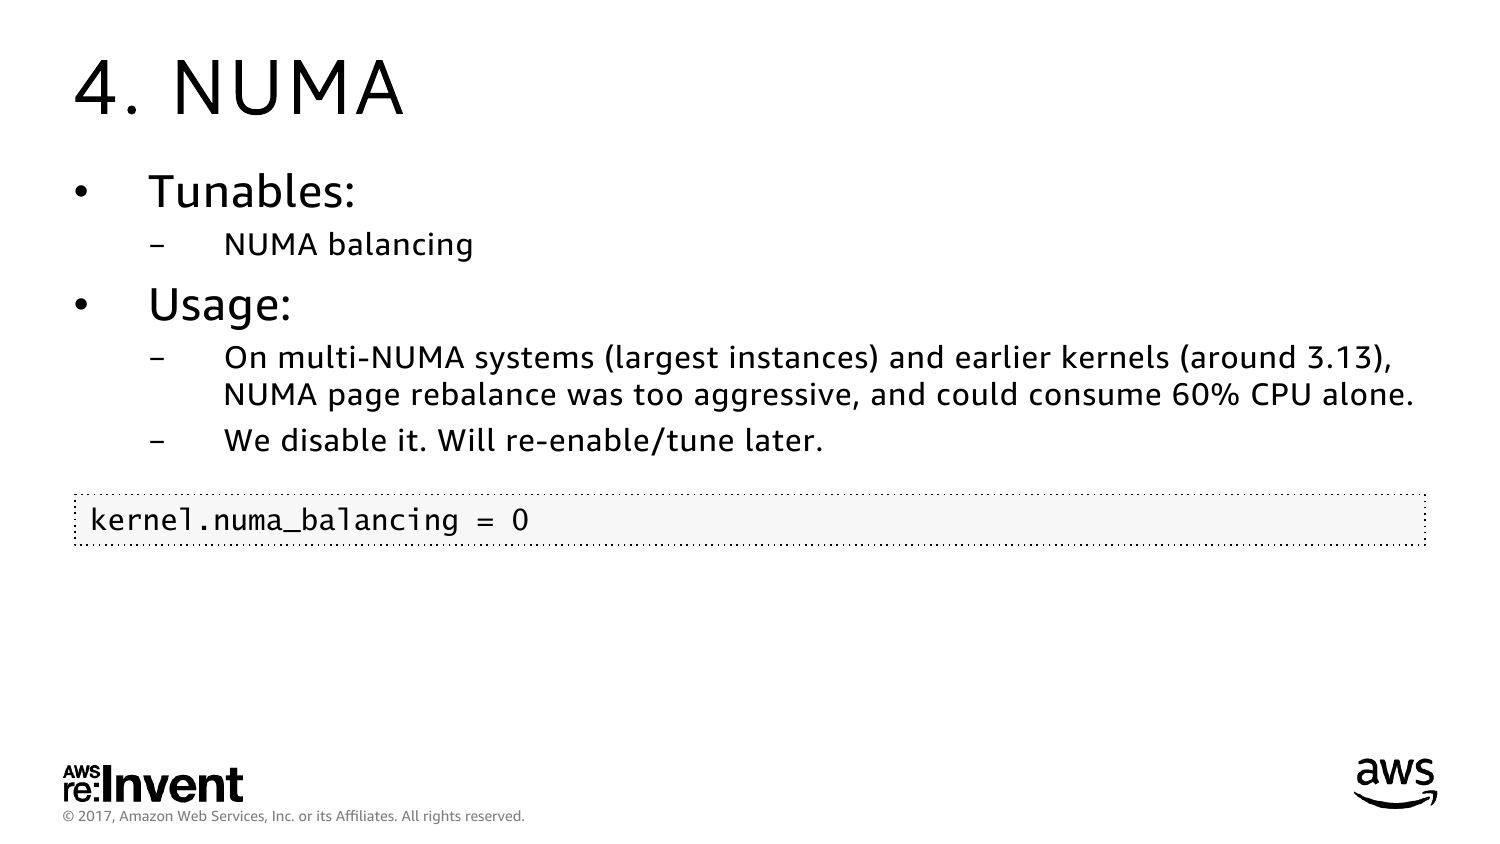
4. NUMA
Tunables:
NUMA balancing
Usage:
On multi-NUMA systems (largest instances) and earlier kernels (around 3.13),
NUMA page rebalance was too aggressive, and could consume 60% CPU alone.
We disable it. Will re-enable/tune later.
kernel.numa_balancing = 0
© 2017, Amazon Web Services, Inc. or its Affiliates. All rights reserved.
slide 31:
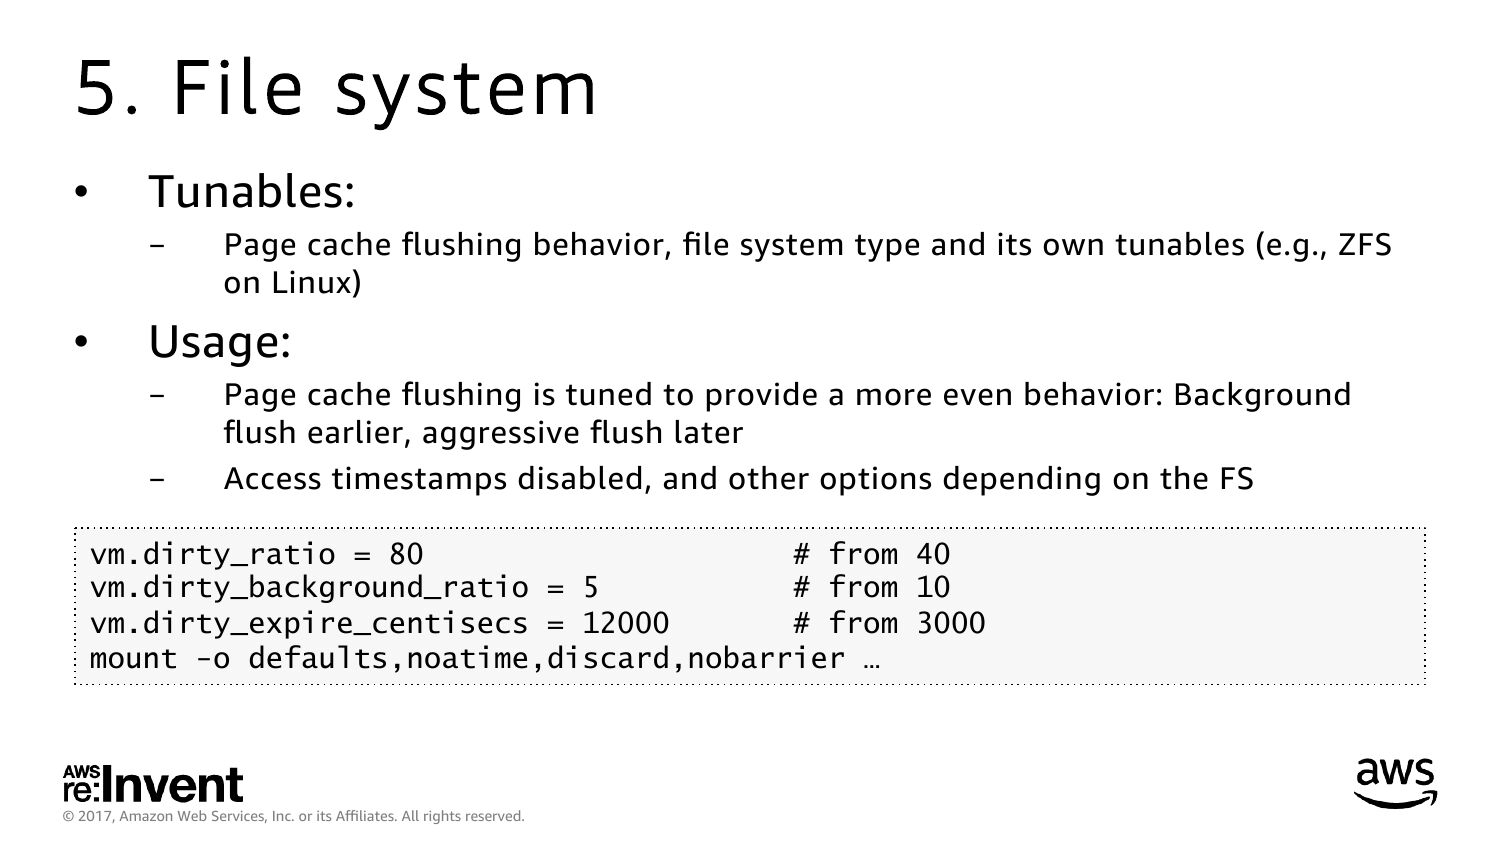
5. File system
Tunables:
Page cache flushing behavior, file system type and its own tunables (e.g., ZFS
on Linux)
Usage:
Page cache flushing is tuned to provide a more even behavior: Background
flush earlier, aggressive flush later
Access timestamps disabled, and other options depending on the FS
vm.dirty_ratio = 80
# from 40
vm.dirty_background_ratio = 5
# from 10
vm.dirty_expire_centisecs = 12000
# from 3000
mount -o defaults,noatime,discard,nobarrier …
© 2017, Amazon Web Services, Inc. or its Affiliates. All rights reserved.
slide 32:
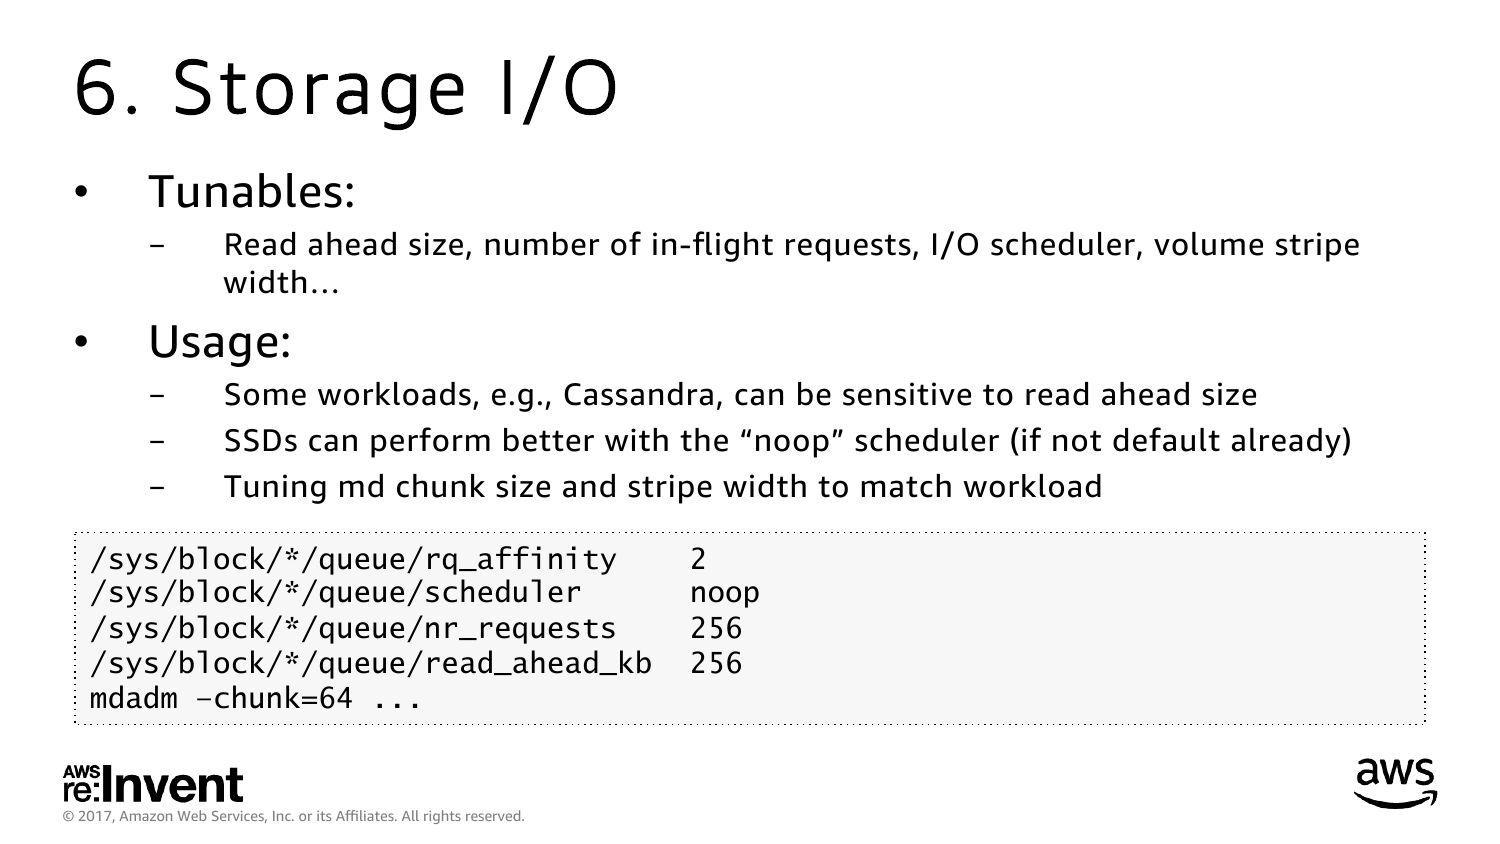
6. Storage I/O
Tunables:
Read ahead size, number of in-flight requests, I/O scheduler, volume stripe
width…
Usage:
Some workloads, e.g., Cassandra, can be sensitive to read ahead size
SSDs can perform better with the “noop” scheduler (if not default already)
Tuning md chunk size and stripe width to match workload
/sys/block/*/queue/rq_affinity
/sys/block/*/queue/scheduler
/sys/block/*/queue/nr_requests
/sys/block/*/queue/read_ahead_kb
mdadm –chunk=64 ...
© 2017, Amazon Web Services, Inc. or its Affiliates. All rights reserved.
noop
slide 33:
7. Networking
Tunables:
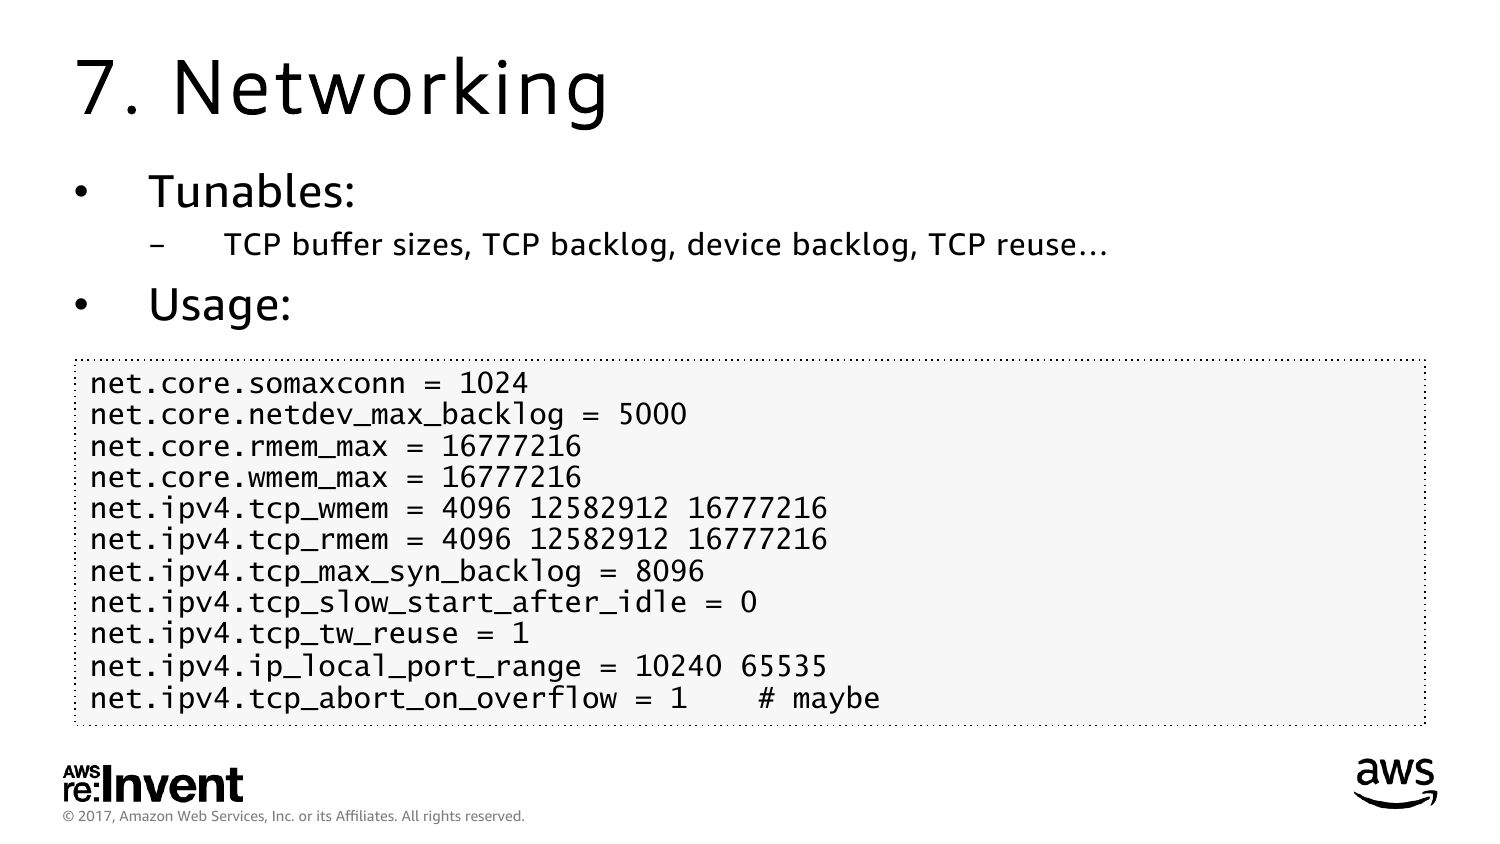
TCP buffer sizes, TCP backlog, device backlog, TCP reuse…
Usage:
net.core.somaxconn = 1024
net.core.netdev_max_backlog = 5000
net.core.rmem_max = 16777216
net.core.wmem_max = 16777216
net.ipv4.tcp_wmem = 4096 12582912 16777216
net.ipv4.tcp_rmem = 4096 12582912 16777216
net.ipv4.tcp_max_syn_backlog = 8096
net.ipv4.tcp_slow_start_after_idle = 0
net.ipv4.tcp_tw_reuse = 1
net.ipv4.ip_local_port_range = 10240 65535
net.ipv4.tcp_abort_on_overflow = 1
# maybe
© 2017, Amazon Web Services, Inc. or its Affiliates. All rights reserved.
slide 34:
8. Hypervisor (Xen)
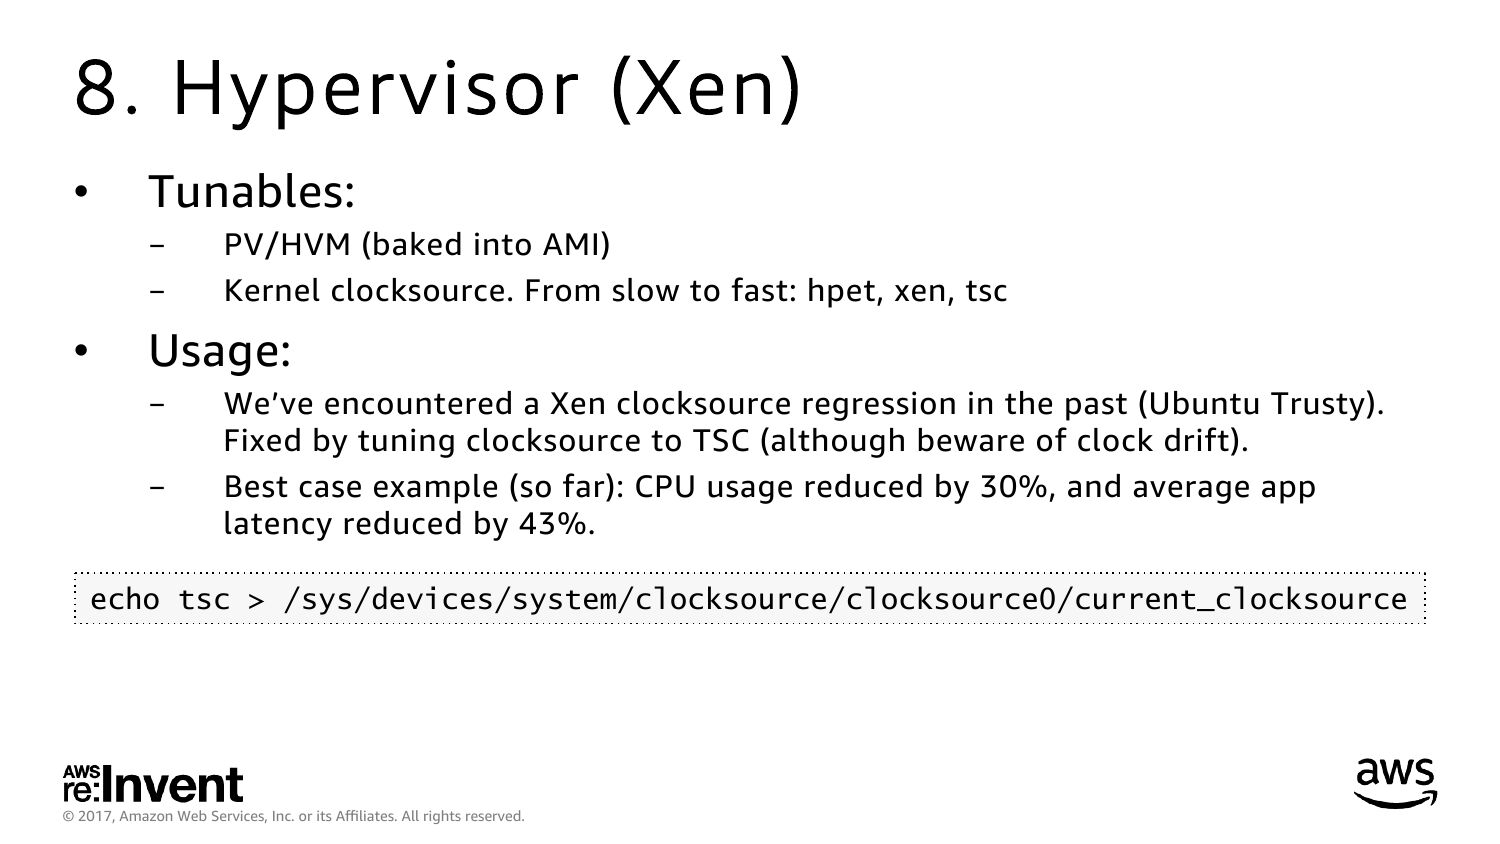
Tunables:
PV/HVM (baked into AMI)
Kernel clocksource. From slow to fast: hpet, xen, tsc
Usage:
We’ve encountered a Xen clocksource regression in the past (Ubuntu Trusty).
Fixed by tuning clocksource to TSC (although beware of clock drift).
Best case example (so far): CPU usage reduced by 30%, and average app
latency reduced by 43%.
echo tsc >gt; /sys/devices/system/clocksource/clocksource0/current_clocksource
© 2017, Amazon Web Services, Inc. or its Affiliates. All rights reserved.
slide 35:
4. Methodologies
Techniques of performance analysis
© 2017, Amazon Web Services, Inc. or its Affiliates. All rights reserved.
slide 36:
Checklists: e.g., Netflix perf vitals
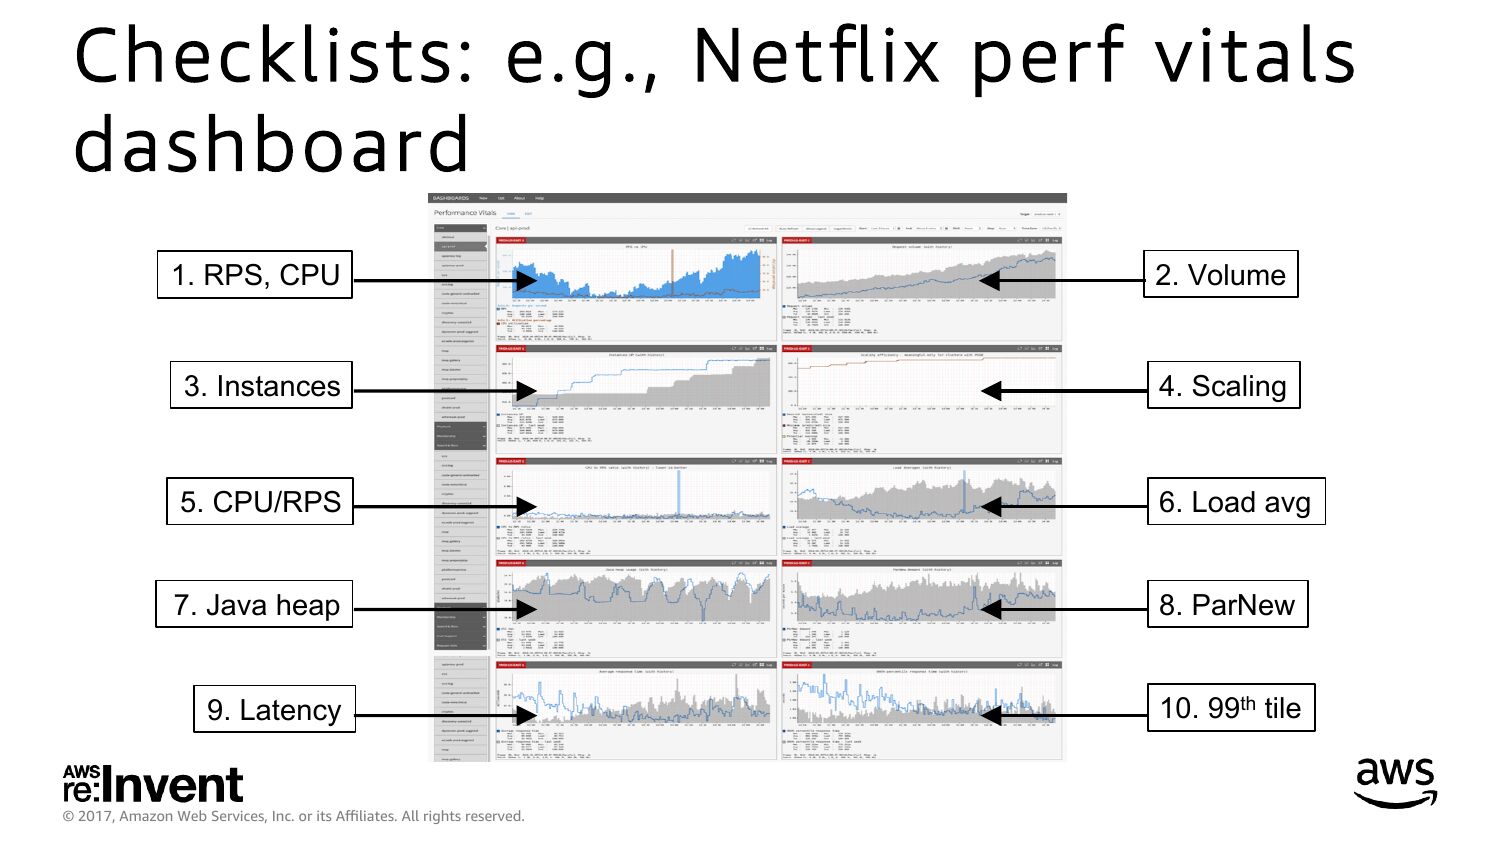
dashboard
1. RPS, CPU
2. Volume
3. Instances
4. Scaling
5. CPU/RPS
6. Load avg
7. Java heap
8. ParNew
9. Latency
10. 99th tile
© 2017, Amazon Web Services, Inc. or its Affiliates. All rights reserved.
slide 37:
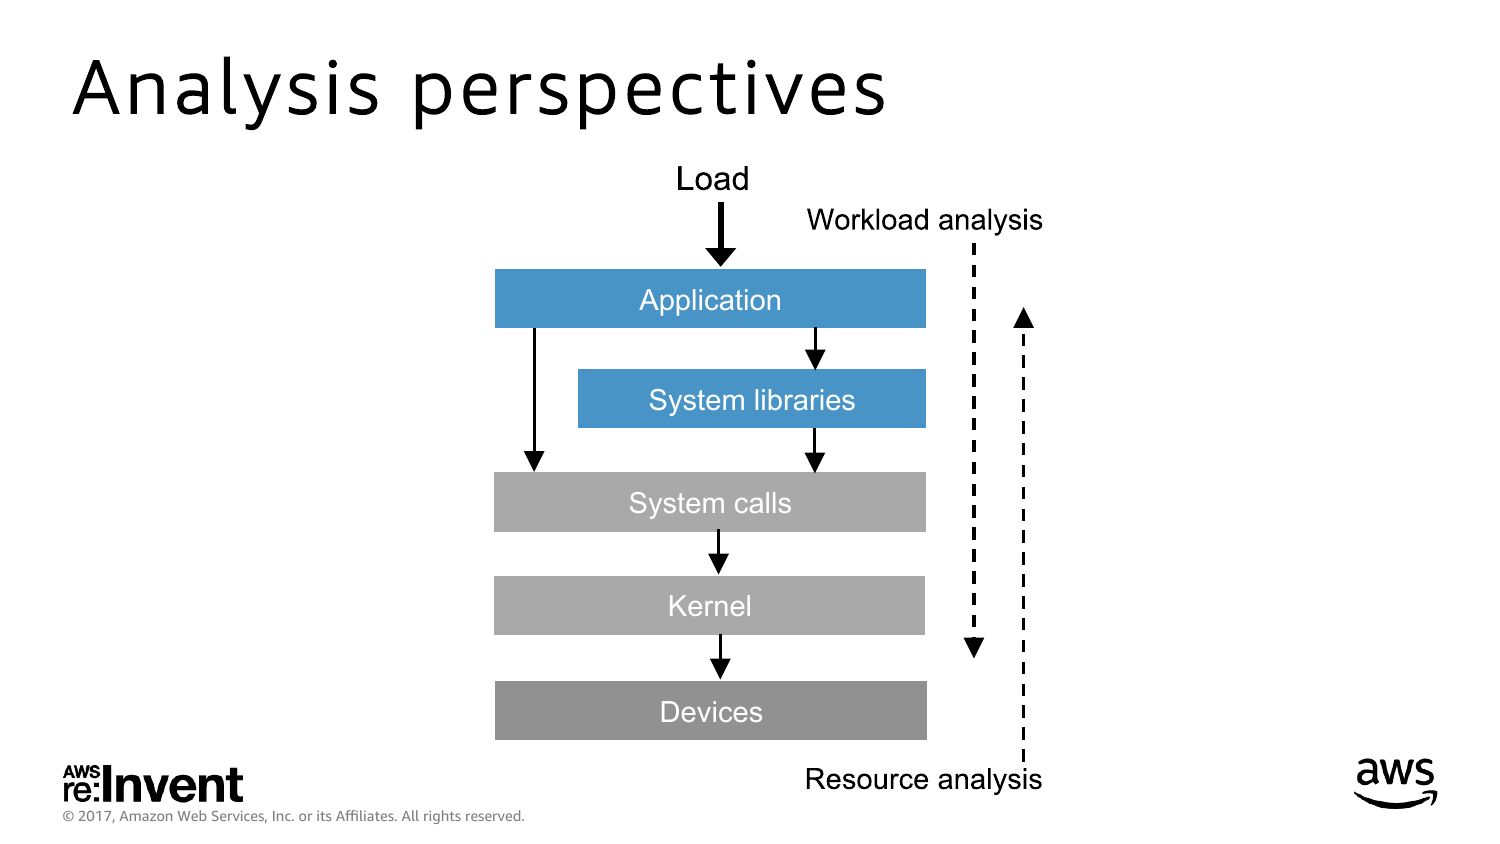
Analysis perspectives
Application
System libraries
System calls
Kernel
Devices
© 2017, Amazon Web Services, Inc. or its Affiliates. All rights reserved.
slide 38:
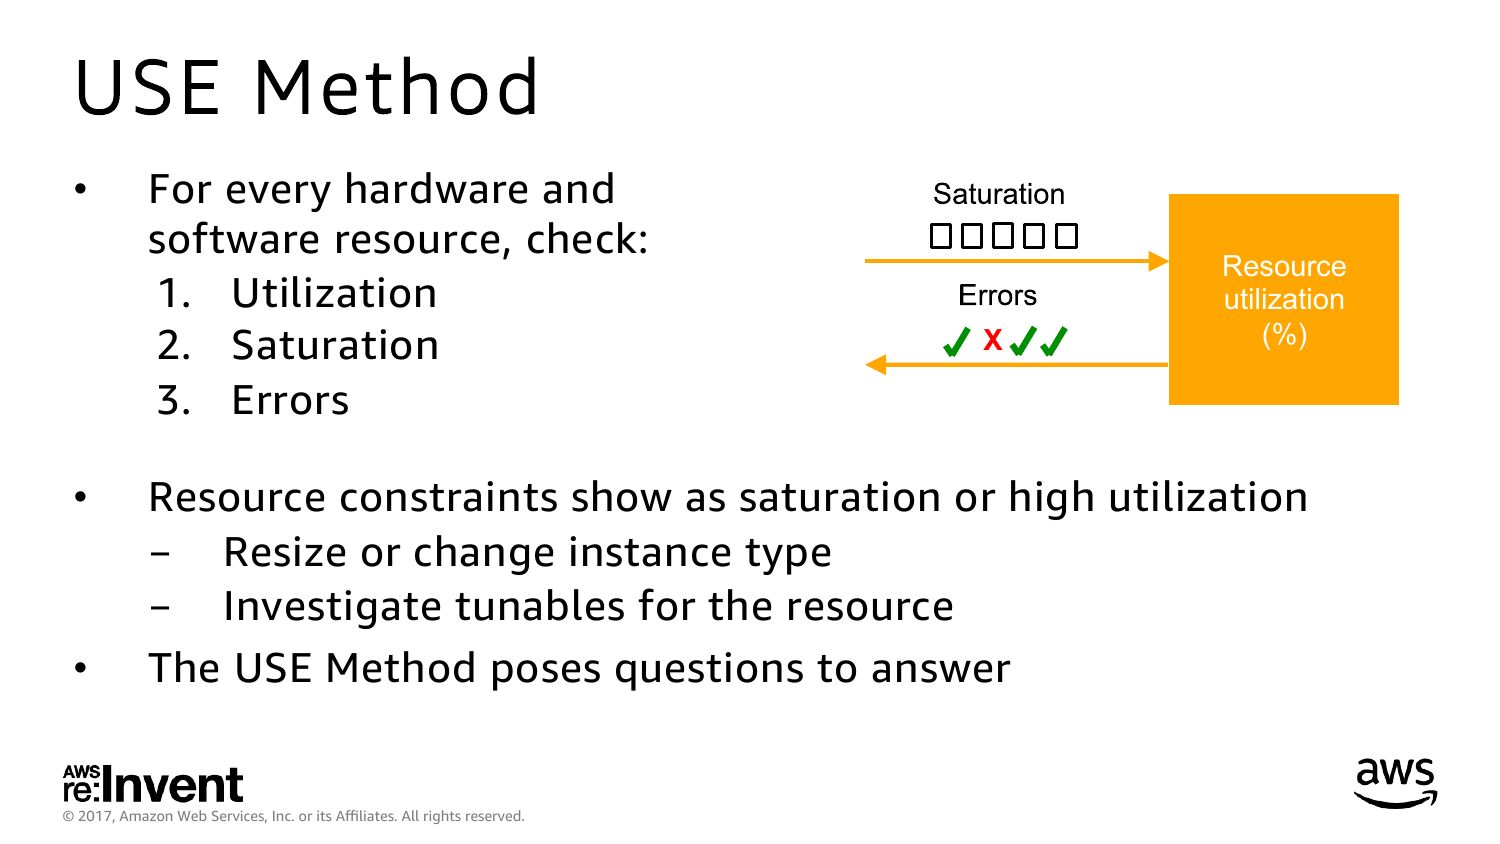
USE Method
For every hardware and
software resource, check:
1. Utilization
2. Saturation
3. Errors
Resource
utilization
(%)
Resource constraints show as saturation or high utilization
- Resize or change instance type
- Investigate tunables for the resource
The USE Method poses questions to answer
© 2017, Amazon Web Services, Inc. or its Affiliates. All rights reserved.
slide 39:
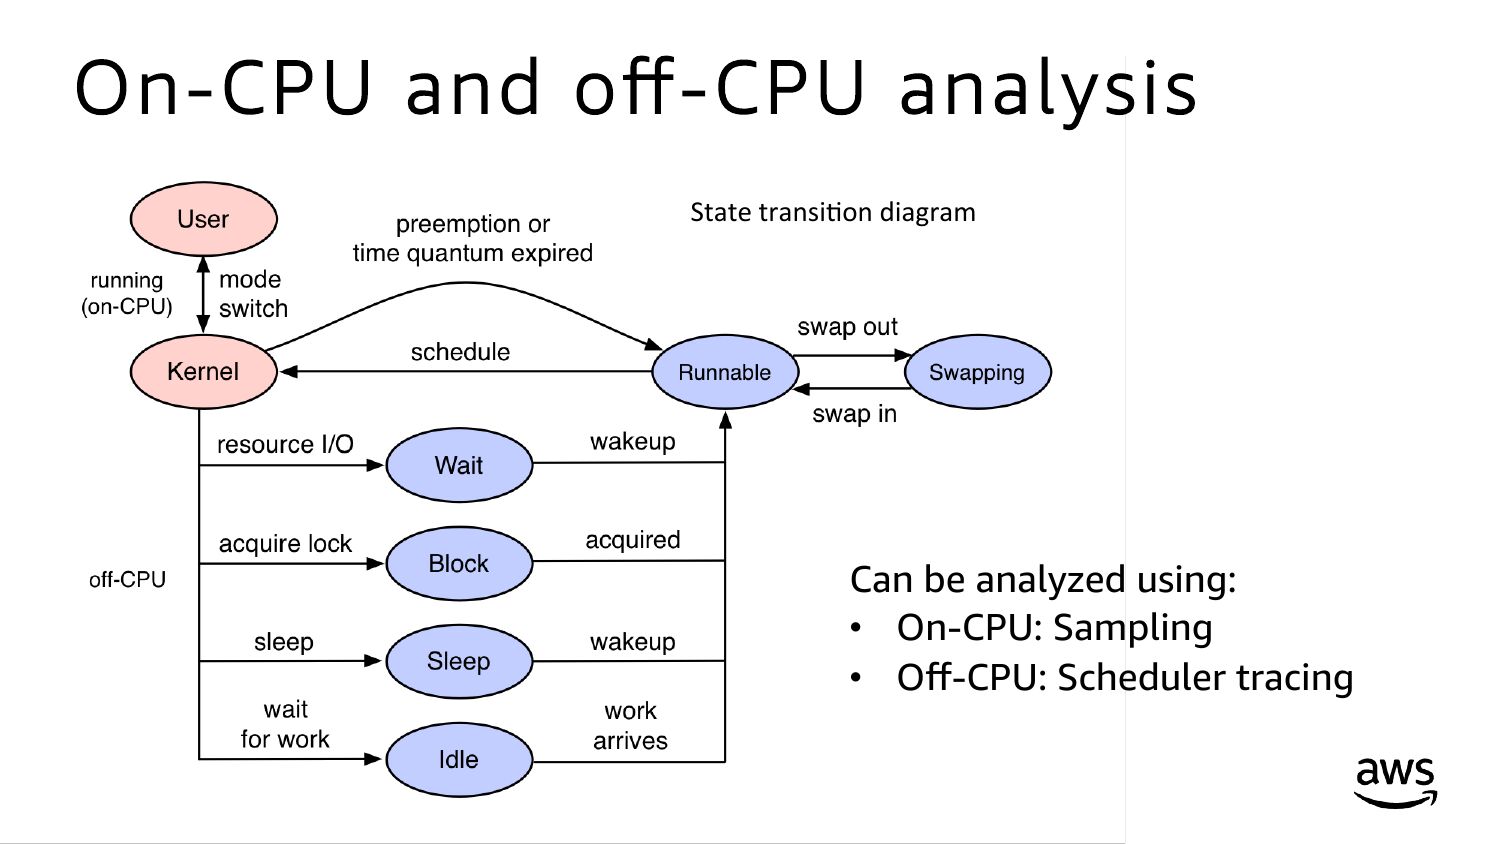
On-CPU and off-CPU analysis
State transi*on diagram
Can be analyzed using:
• On-CPU: Sampling
• Off-CPU: Scheduler tracing
© 2017, Amazon Web Services, Inc. or its Affiliates. All rights reserved.
slide 40:
5. Observability
Finding, quantifying, and confirming tunables
Discovering system wins (5-25%’s) and application wins (2-10x’s)
© 2017, Amazon Web Services, Inc. or its Affiliates. All rights reserved.
slide 41:
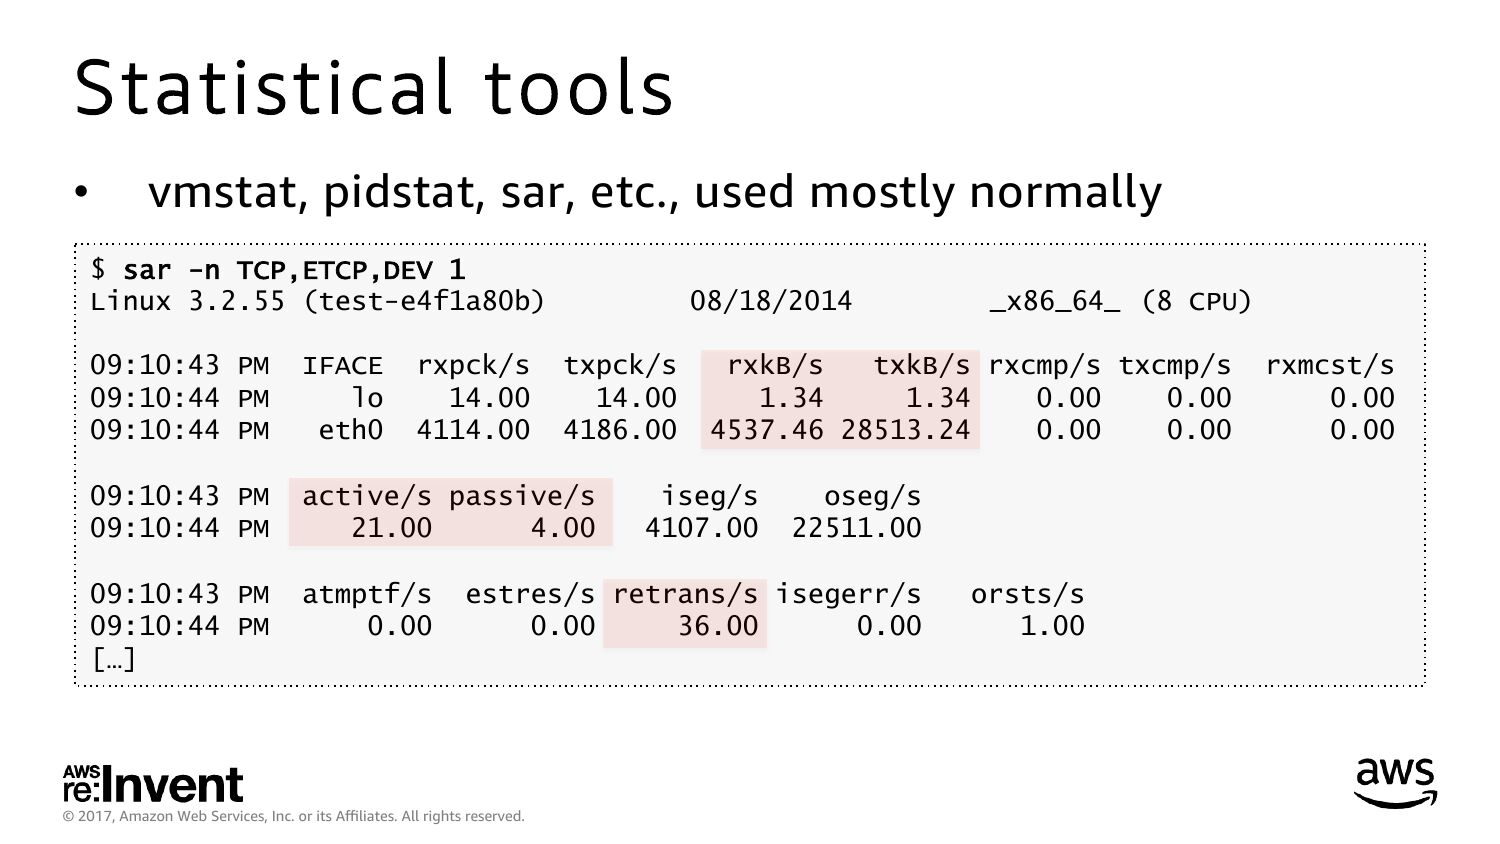
Statistical tools
vmstat, pidstat, sar, etc., used mostly normally
$ sar -n TCP,ETCP,DEV 1
Linux 3.2.55 (test-e4f1a80b)
rxpck/s
08/18/2014
09:10:43 PM
09:10:44 PM
09:10:44 PM
IFACE
eth0
txpck/s
09:10:43 PM
09:10:44 PM
active/s passive/s
09:10:43 PM
09:10:44 PM
[…]
atmptf/s
rxkB/s
txkB/s rxcmp/s txcmp/s
4537.46 28513.24
iseg/s
oseg/s
estres/s retrans/s isegerr/s
© 2017, Amazon Web Services, Inc. or its Affiliates. All rights reserved.
_x86_64_ (8 CPU)
orsts/s
rxmcst/s
slide 42:
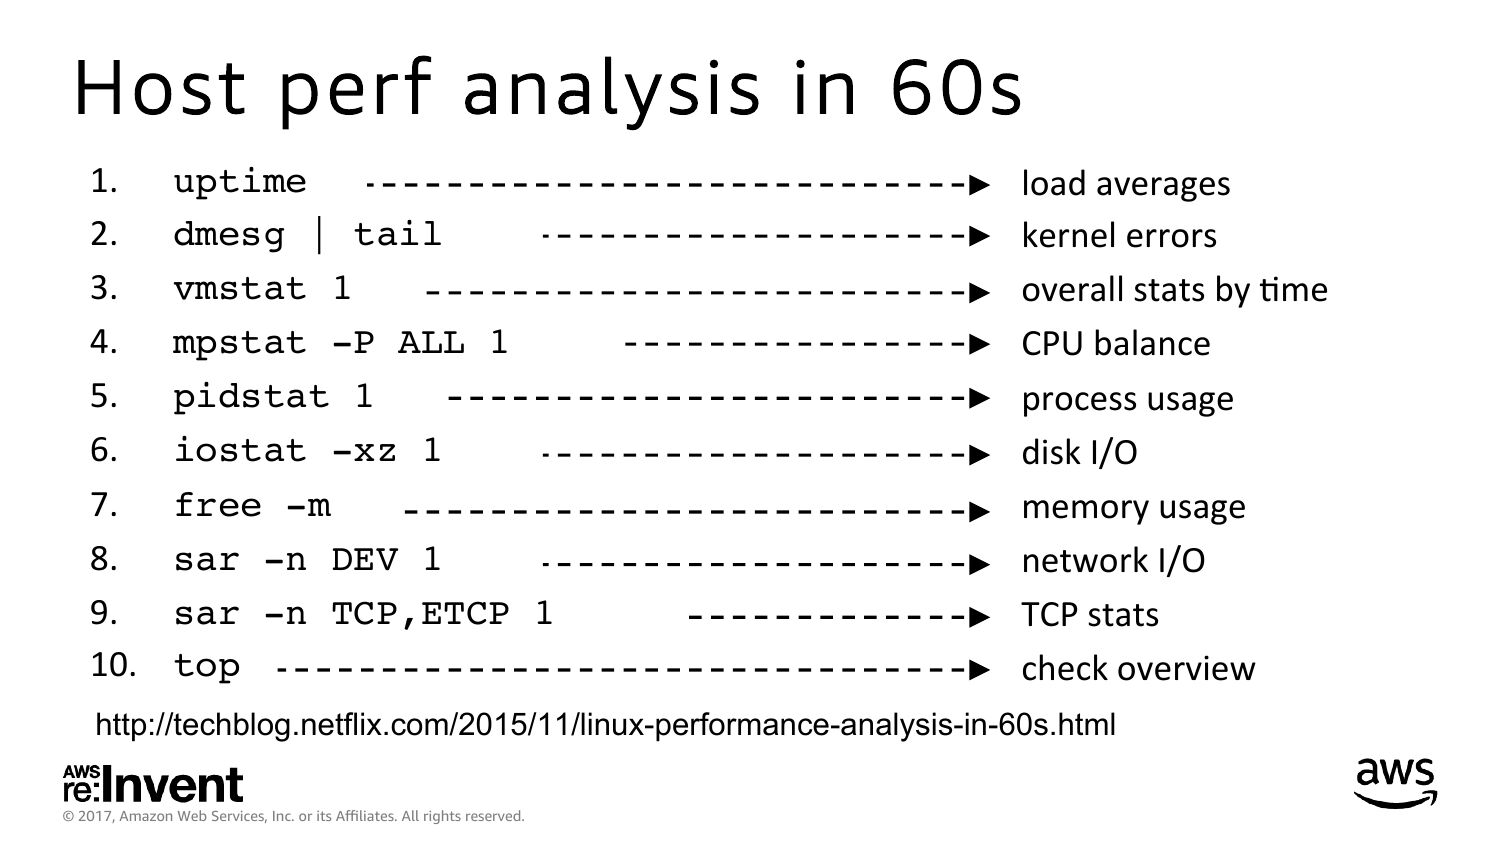
Host perf analysis in 60s
uptime
dmesg | tail
vmstat 1
mpstat -P ALL 1
pidstat 1
iostat -xz 1
free -m
sar -n DEV 1
sar -n TCP,ETCP 1
top
load averages
kernel errors
overall stats by *me
CPU balance
process usage
disk I/O
memory usage
network I/O
TCP stats
check overview
http://techblog.netflix.com/2015/11/linux-performance-analysis-in-60s.html
© 2017, Amazon Web Services, Inc. or its Affiliates. All rights reserved.
slide 43:
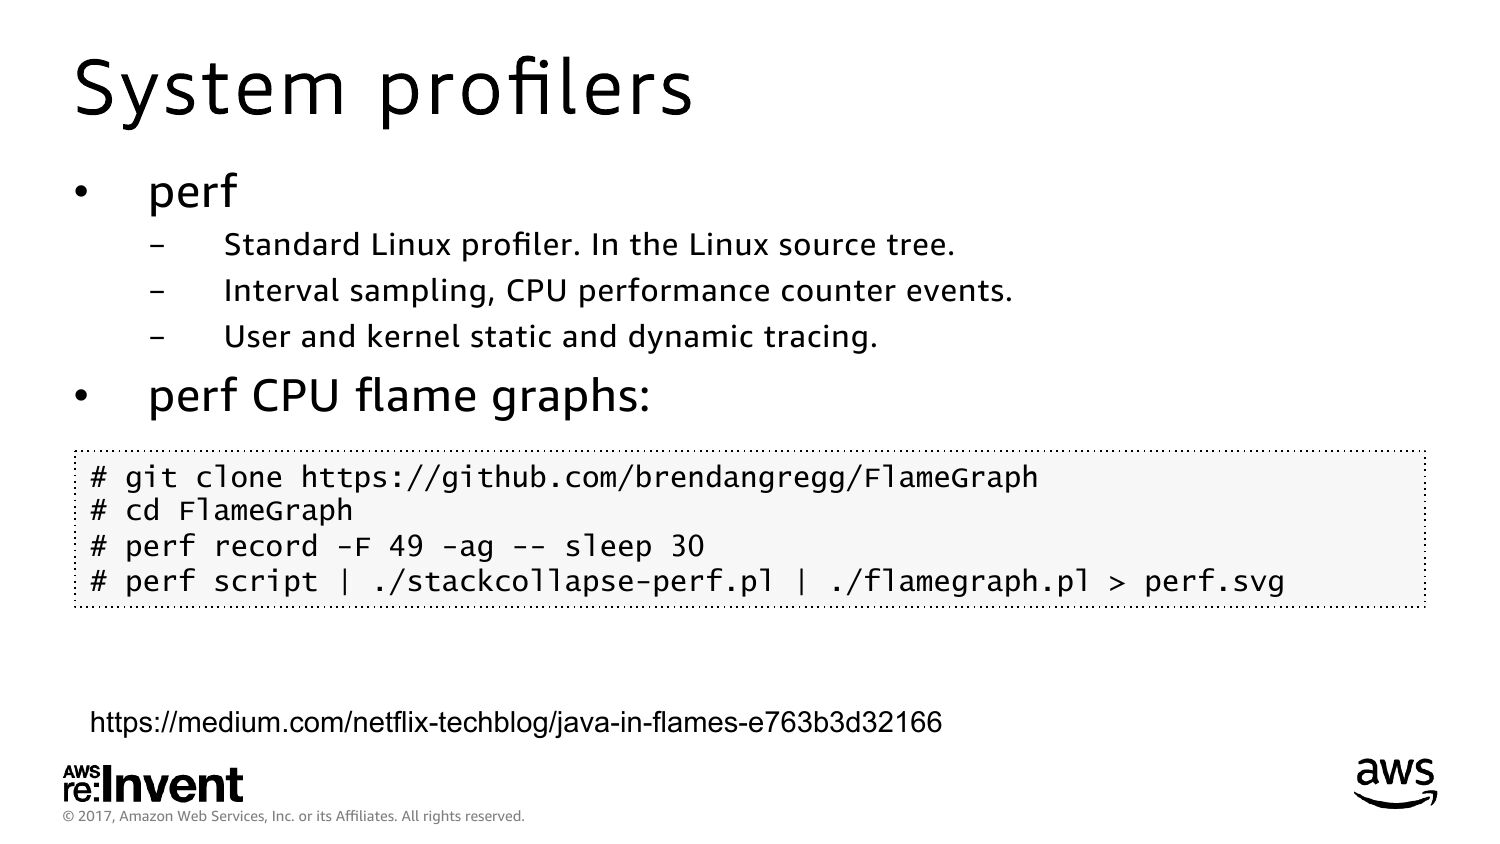
System profilers
perf
Standard Linux profiler. In the Linux source tree.
Interval sampling, CPU performance counter events.
User and kernel static and dynamic tracing.
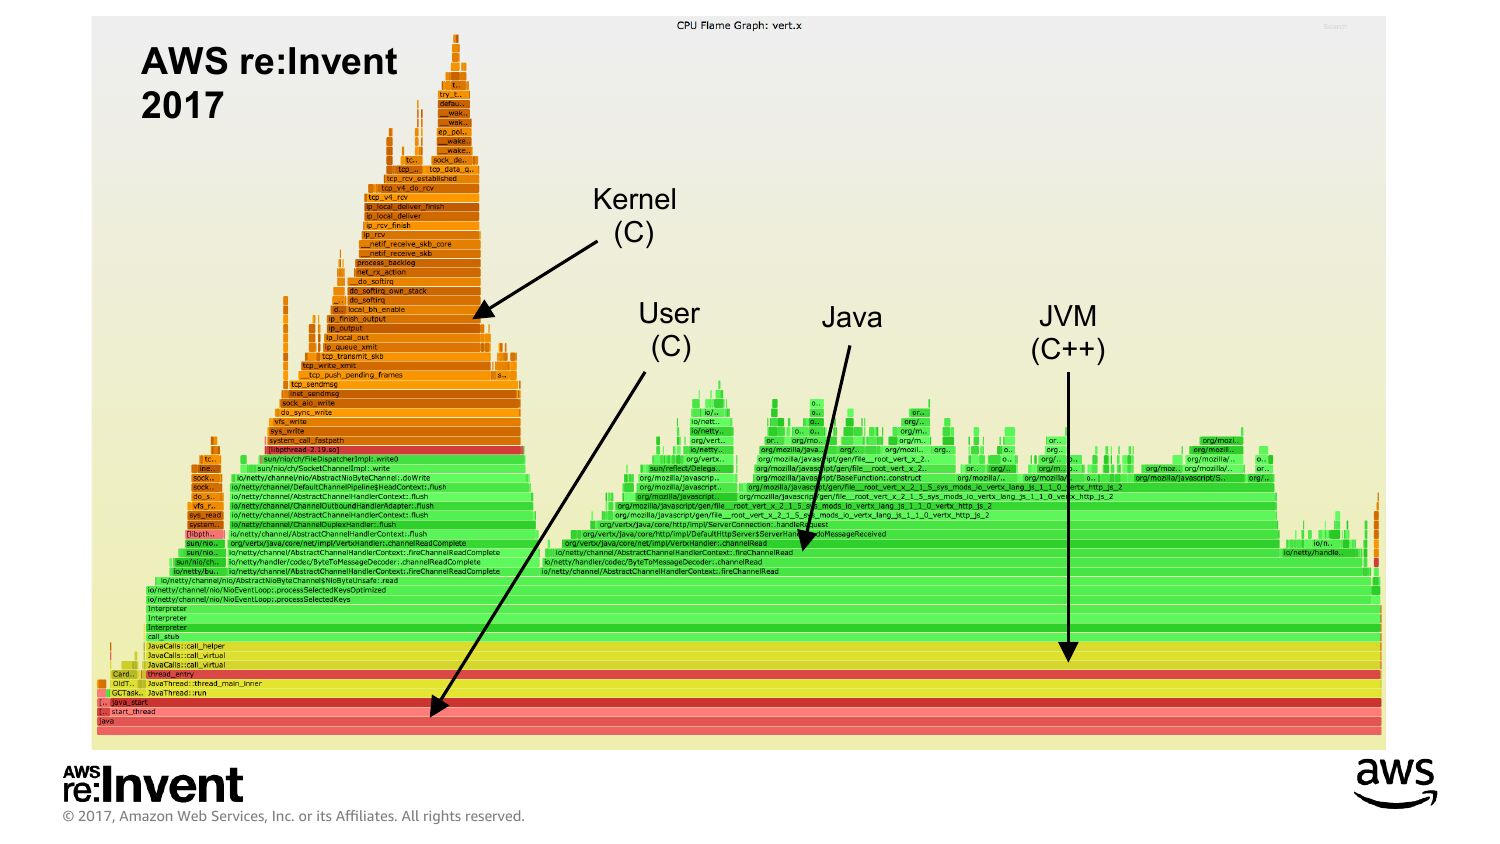
perf CPU flame graphs:
# git clone https://github.com/brendangregg/FlameGraph
# cd FlameGraph
# perf record -F 49 -ag -- sleep 30
# perf script | ./stackcollapse-perf.pl | ./flamegraph.pl >gt; perf.svg
https://medium.com/netflix-techblog/java-in-flames-e763b3d32166
© 2017, Amazon Web Services, Inc. or its Affiliates. All rights reserved.
slide 44:
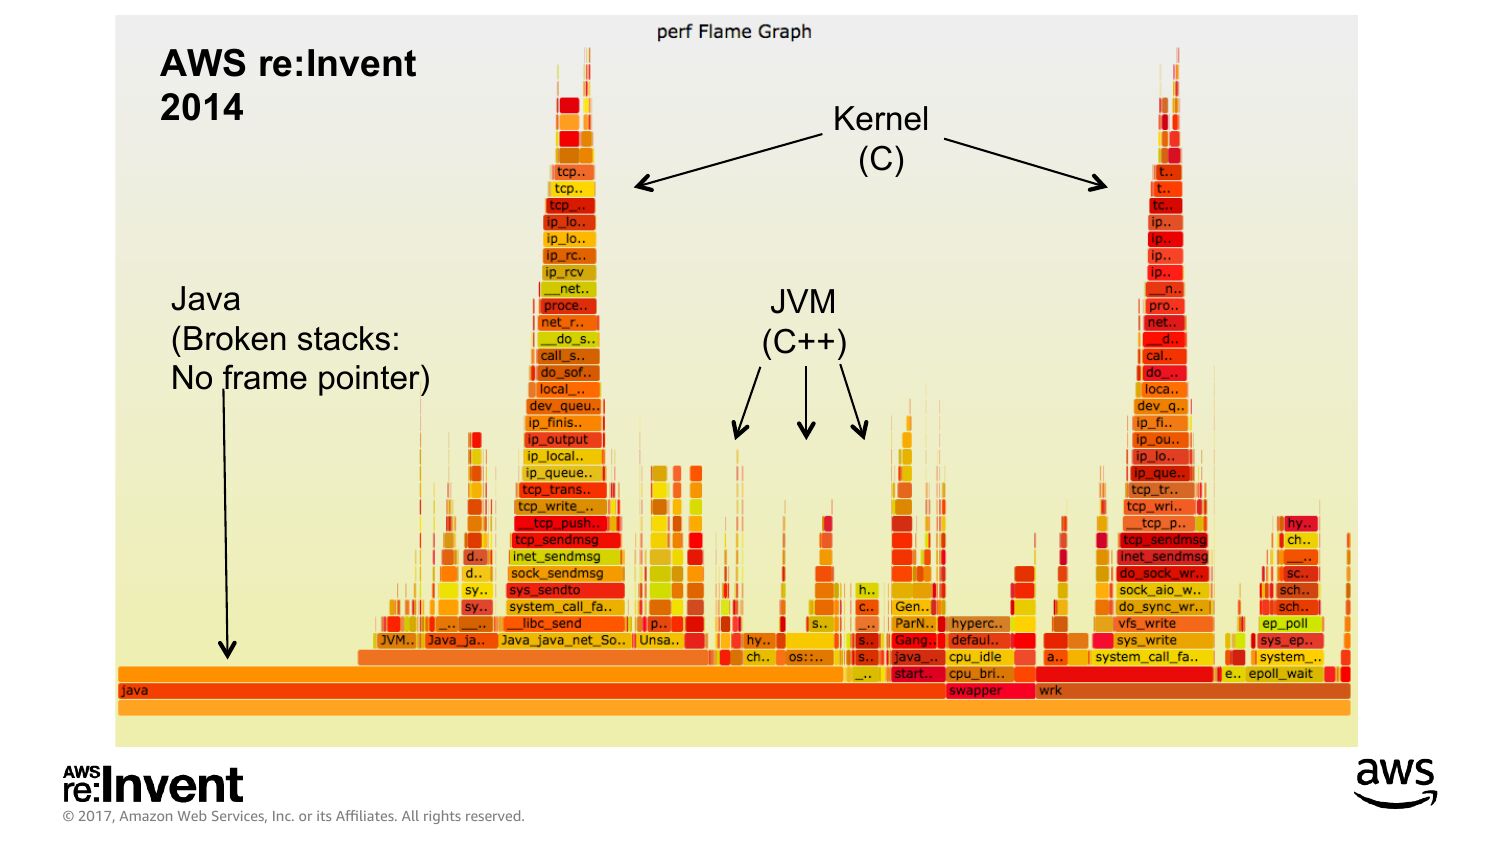
AWS re:Invent
Java
(Broken stacks:
No frame pointer)
© 2017, Amazon Web Services, Inc. or its Affiliates. All rights reserved.
Kernel
(C)
JVM
(C++)
slide 45:
AWS re:Invent
Kernel
(C)
User
(C)
© 2017, Amazon Web Services, Inc. or its Affiliates. All rights reserved.
Java
JVM
(C++)
slide 46:
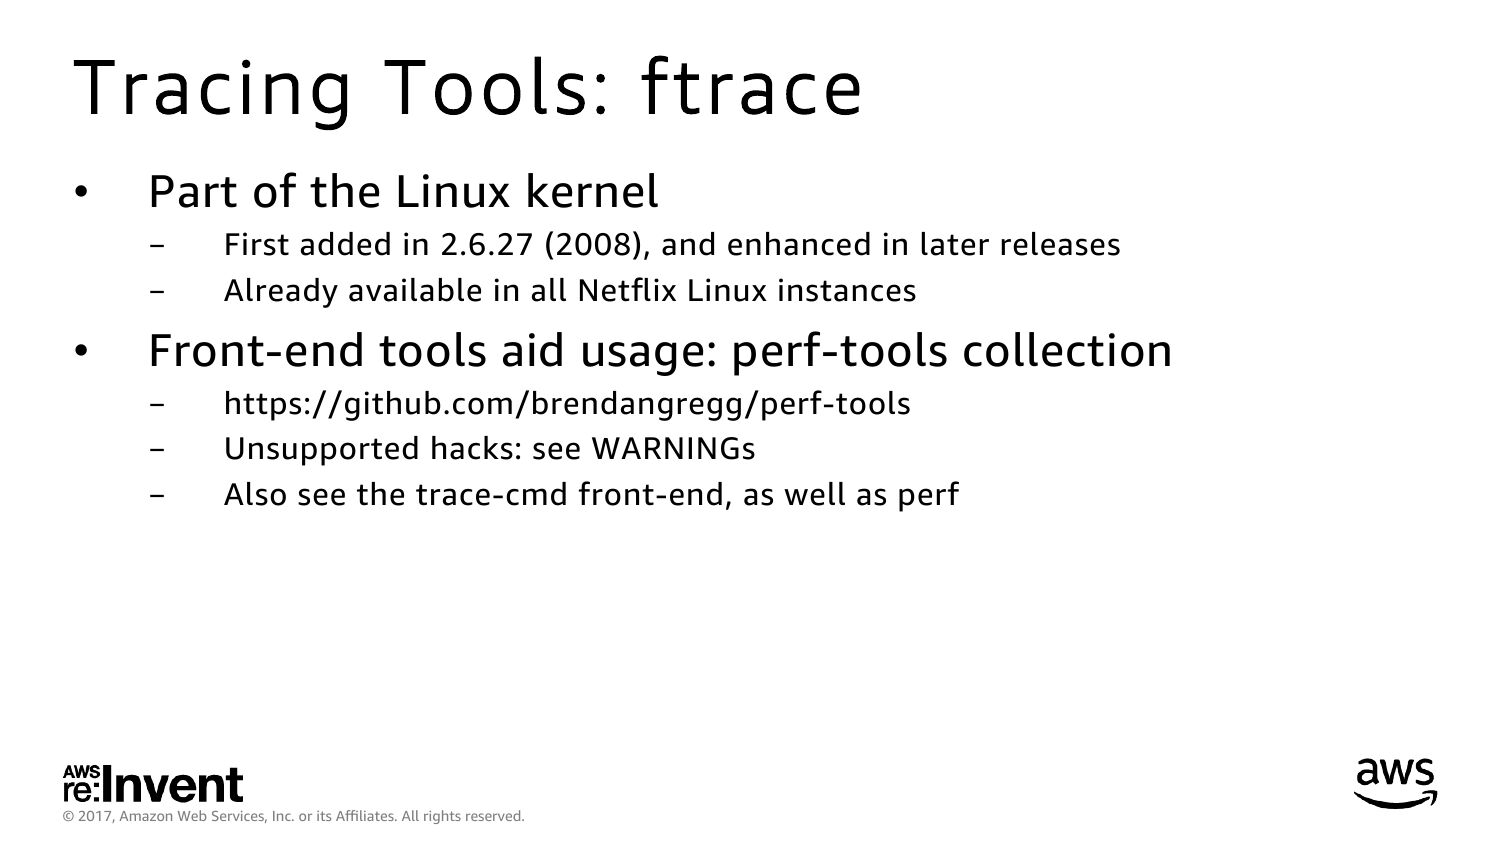
Tracing Tools: ftrace
Part of the Linux kernel
First added in 2.6.27 (2008), and enhanced in later releases
Already available in all Netflix Linux instances
Front-end tools aid usage: perf-tools collection
https://github.com/brendangregg/perf-tools
Unsupported hacks: see WARNINGs
Also see the trace-cmd front-end, as well as perf
© 2017, Amazon Web Services, Inc. or its Affiliates. All rights reserved.
slide 47:
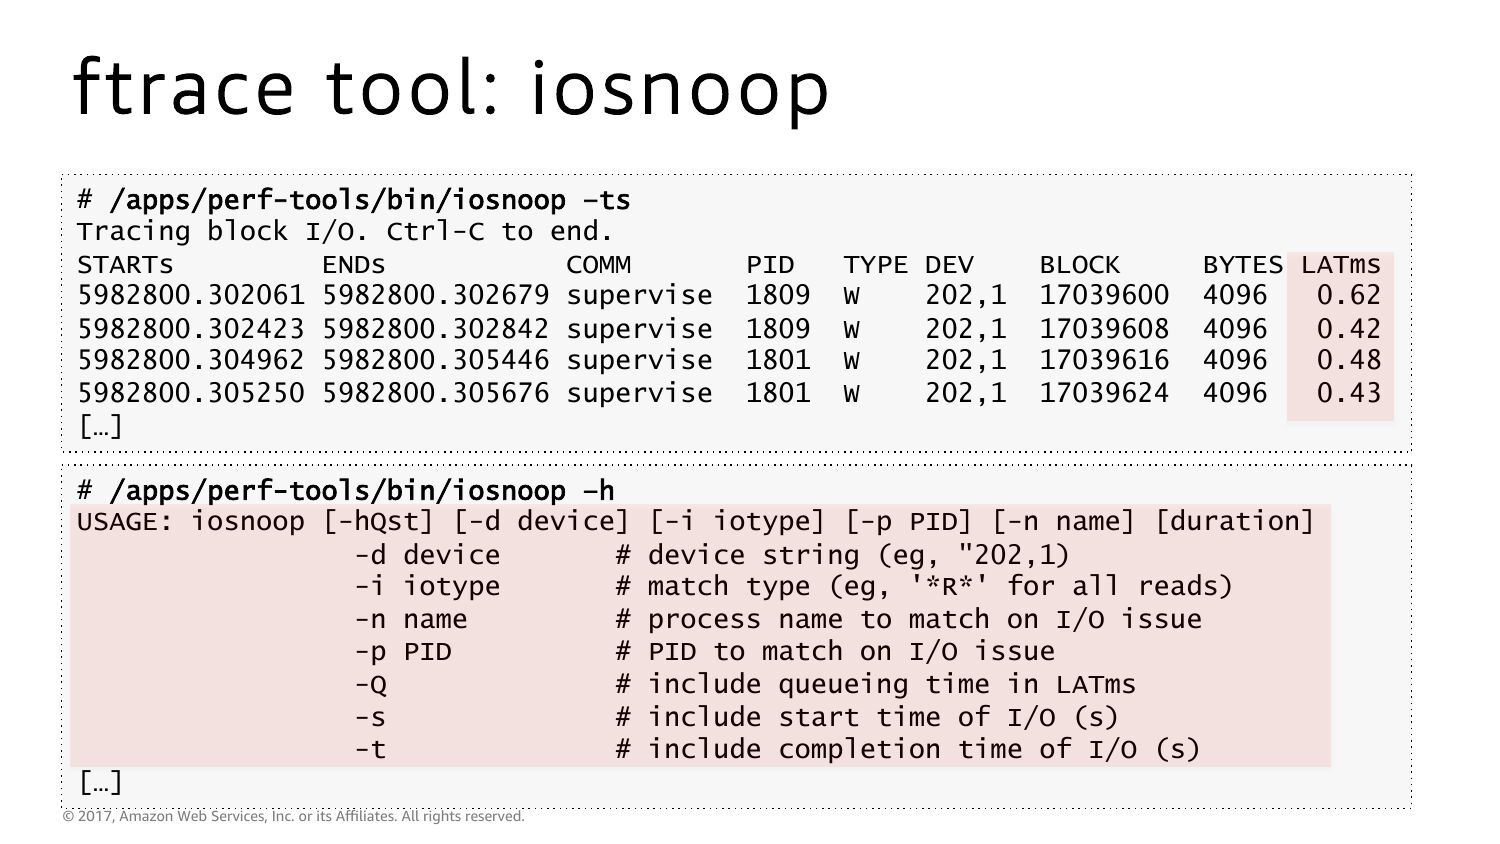
ftrace tool: iosnoop
# /apps/perf-tools/bin/iosnoop –ts
Tracing block I/O. Ctrl-C to end.
STARTs
ENDs
COMM
5982800.302061 5982800.302679 supervise
5982800.302423 5982800.302842 supervise
5982800.304962 5982800.305446 supervise
5982800.305250 5982800.305676 supervise
[…]
PID
TYPE DEV
202,1
202,1
202,1
202,1
BLOCK
BYTES LATms
# /apps/perf-tools/bin/iosnoop –h
USAGE: iosnoop [-hQst] [-d device] [-i iotype] [-p PID] [-n name] [duration]
-d device
# device string (eg, "202,1)
-i iotype
# match type (eg, '*R*' for all reads)
-n name
# process name to match on I/O issue
-p PID
# PID to match on I/O issue
# include queueing time in LATms
# include start time of I/O (s)
# include completion time of I/O (s)
[…]
© 2017, Amazon Web Services, Inc. or its Affiliates. All rights reserved.
slide 48:
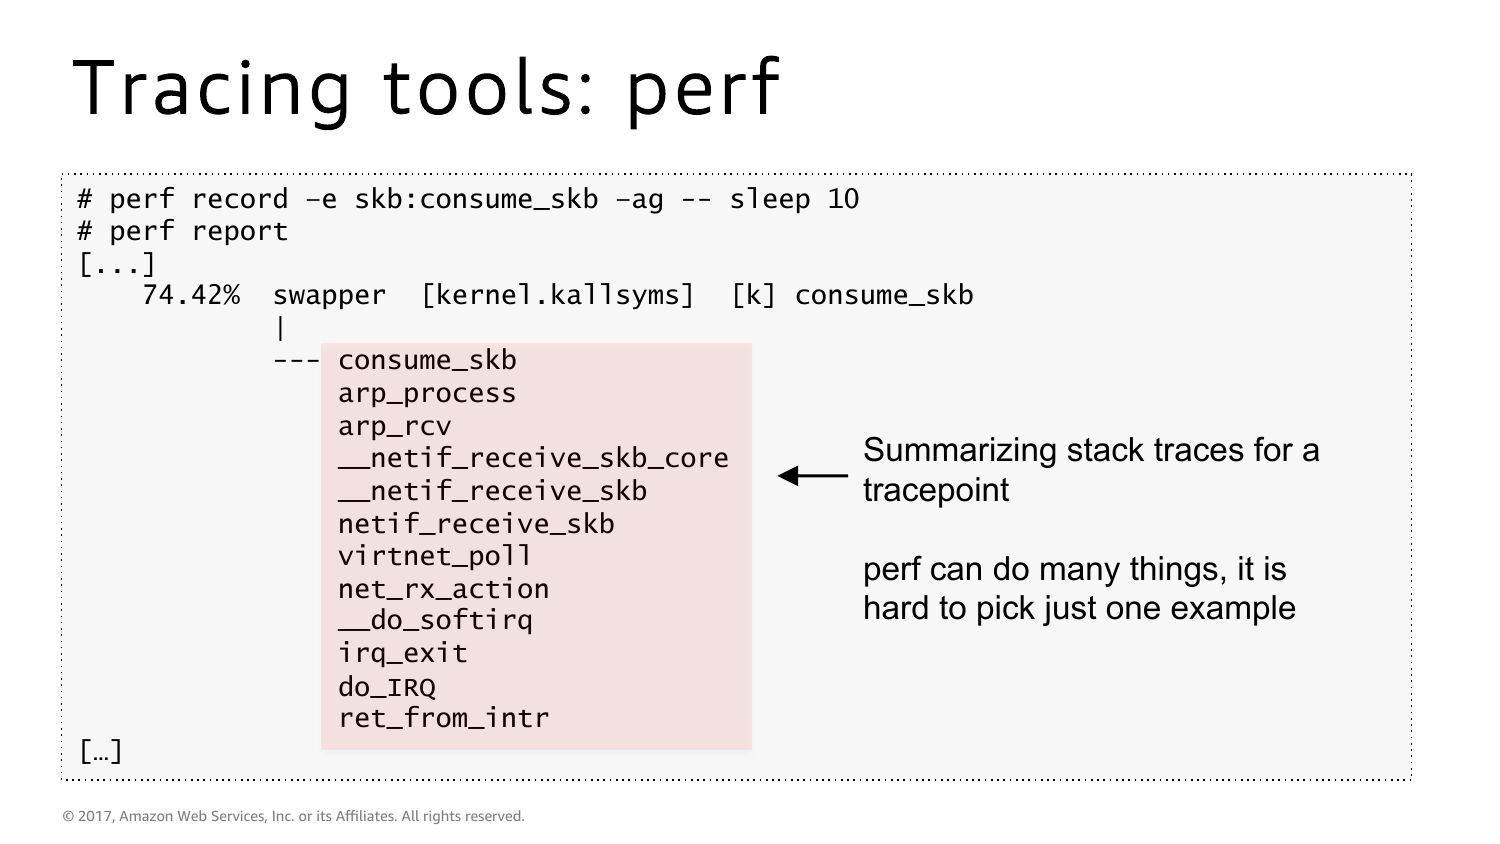
Tracing tools: perf
# perf record –e skb:consume_skb –ag -- sleep 10
# perf report
[...]
74.42% swapper [kernel.kallsyms] [k] consume_skb
--- consume_skb
arp_process
arp_rcv
Summarizing stack traces for a
__netif_receive_skb_core
__netif_receive_skb
tracepoint
netif_receive_skb
virtnet_poll
perf can do many things, it is
net_rx_action
hard to pick just one example
__do_softirq
irq_exit
do_IRQ
ret_from_intr
[…]
© 2017, Amazon Web Services, Inc. or its Affiliates. All rights reserved.
slide 49:
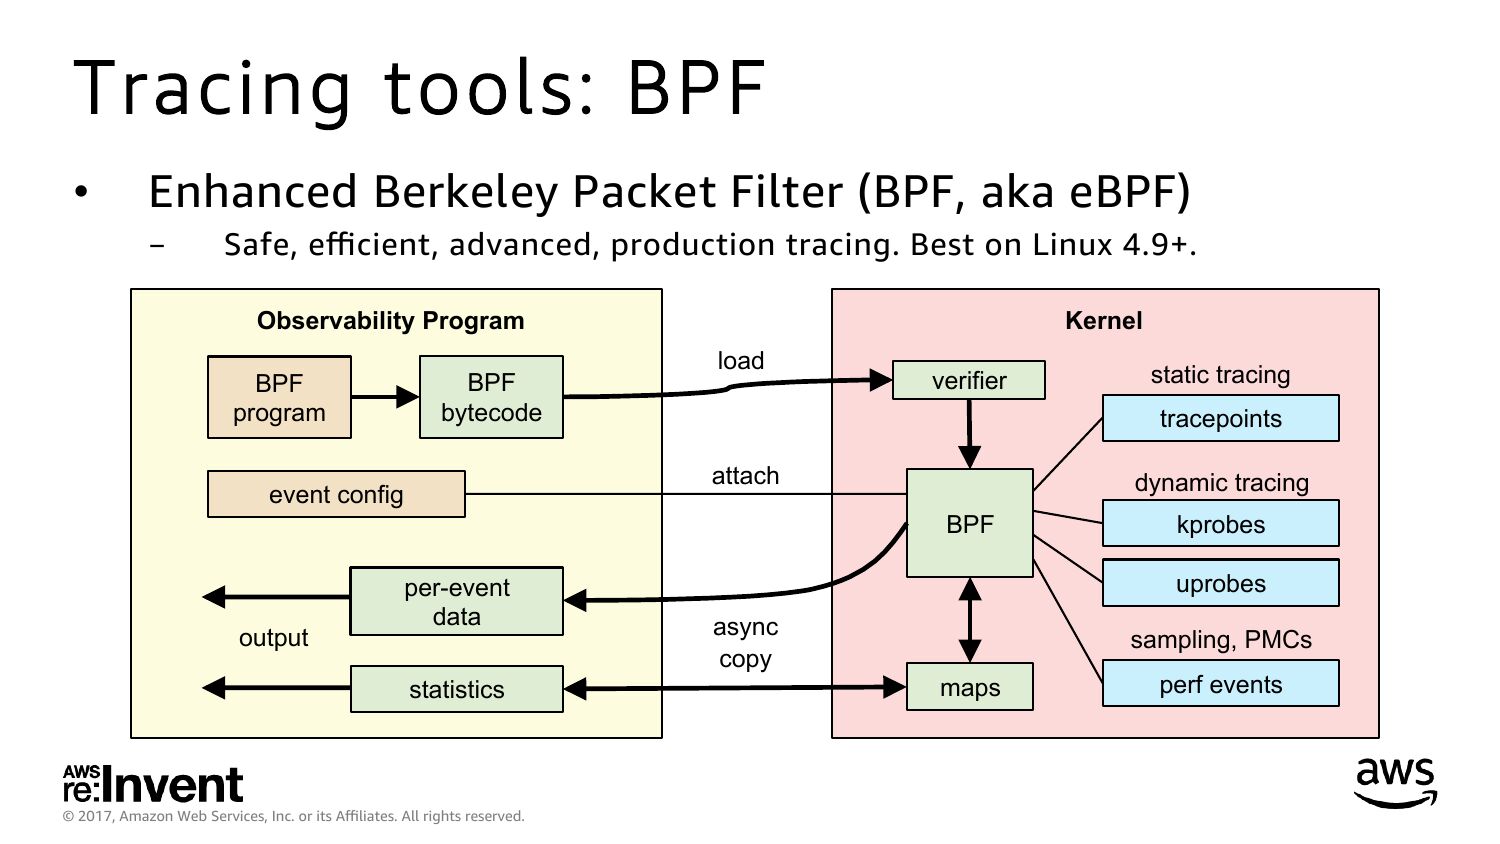
Tracing tools: BPF
Enhanced Berkeley Packet Filter (BPF, aka eBPF)
Safe, efficient, advanced, production tracing. Best on Linux 4.9+.
Observability Program
BPF
program
BPF
bytecode
Kernel
load
verifier
tracepoints
attach
event config
dynamic tracing
BPF
output
per-event
data
statistics
© 2017, Amazon Web Services, Inc. or its Affiliates. All rights reserved.
static tracing
kprobes
uprobes
async
copy
sampling, PMCs
maps
perf events
slide 50:
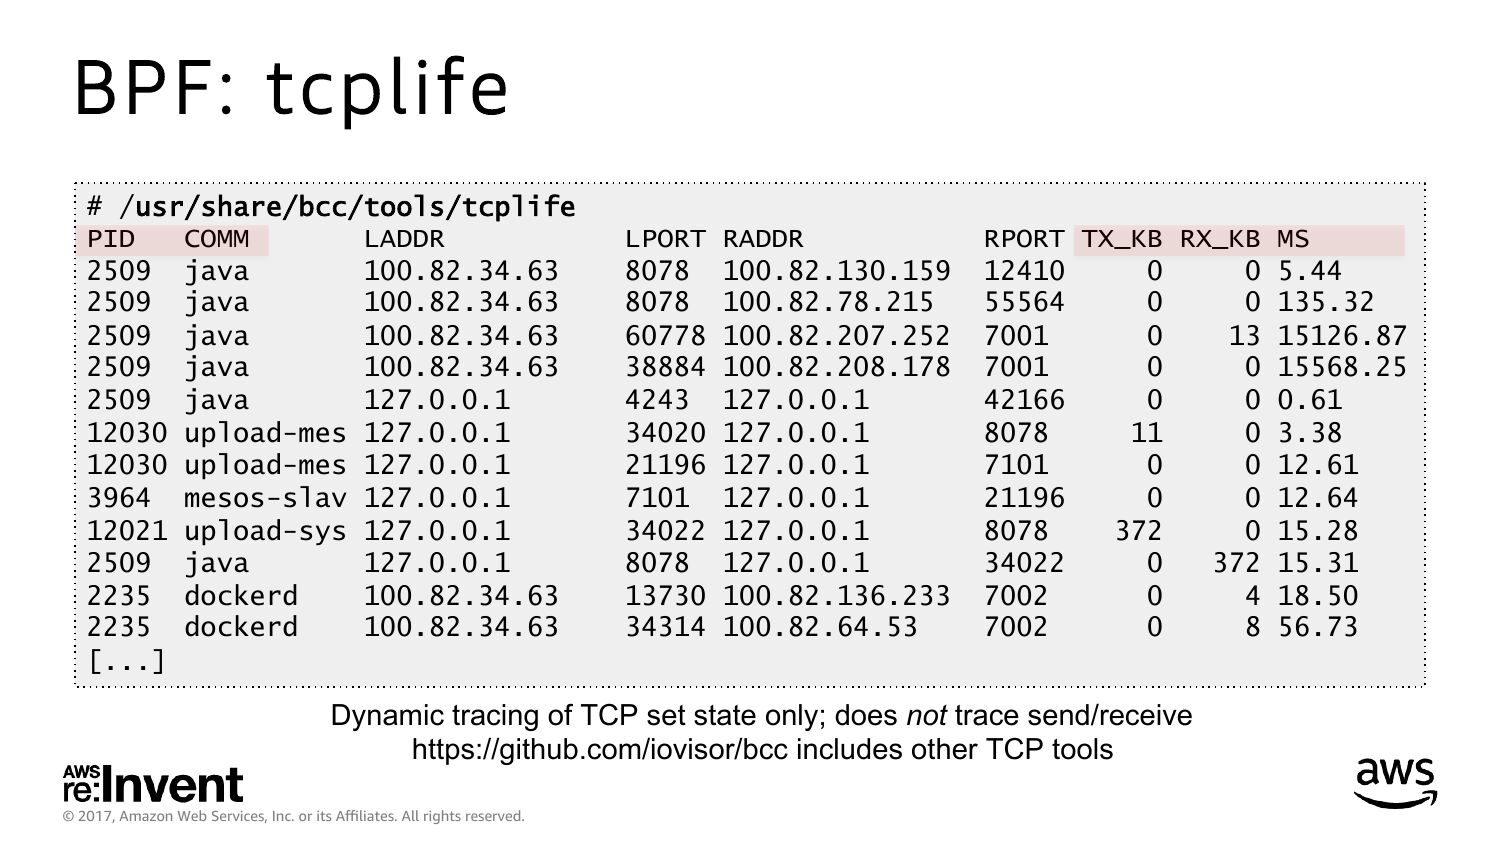
BPF: tcplife
# /usr/share/bcc/tools/tcplife
PID
COMM
LADDR
2509 java
2509 java
2509 java
2509 java
2509 java
12030 upload-mes 127.0.0.1
12030 upload-mes 127.0.0.1
3964 mesos-slav 127.0.0.1
12021 upload-sys 127.0.0.1
2509 java
2235 dockerd
2235 dockerd
[...]
LPORT RADDR
8078 100.82.130.159
8078 100.82.78.215
60778 100.82.207.252
38884 100.82.208.178
4243 127.0.0.1
34020 127.0.0.1
21196 127.0.0.1
7101 127.0.0.1
34022 127.0.0.1
8078 127.0.0.1
13730 100.82.136.233
34314 100.82.64.53
RPORT TX_KB RX_KB MS
0 5.44
0 135.32
13 15126.87
0 15568.25
0 0.61
0 3.38
0 12.61
0 12.64
0 15.28
372 15.31
4 18.50
8 56.73
Dynamic tracing of TCP set state only; does not trace send/receive
https://github.com/iovisor/bcc includes other TCP tools
© 2017, Amazon Web Services, Inc. or its Affiliates. All rights reserved.
slide 51:
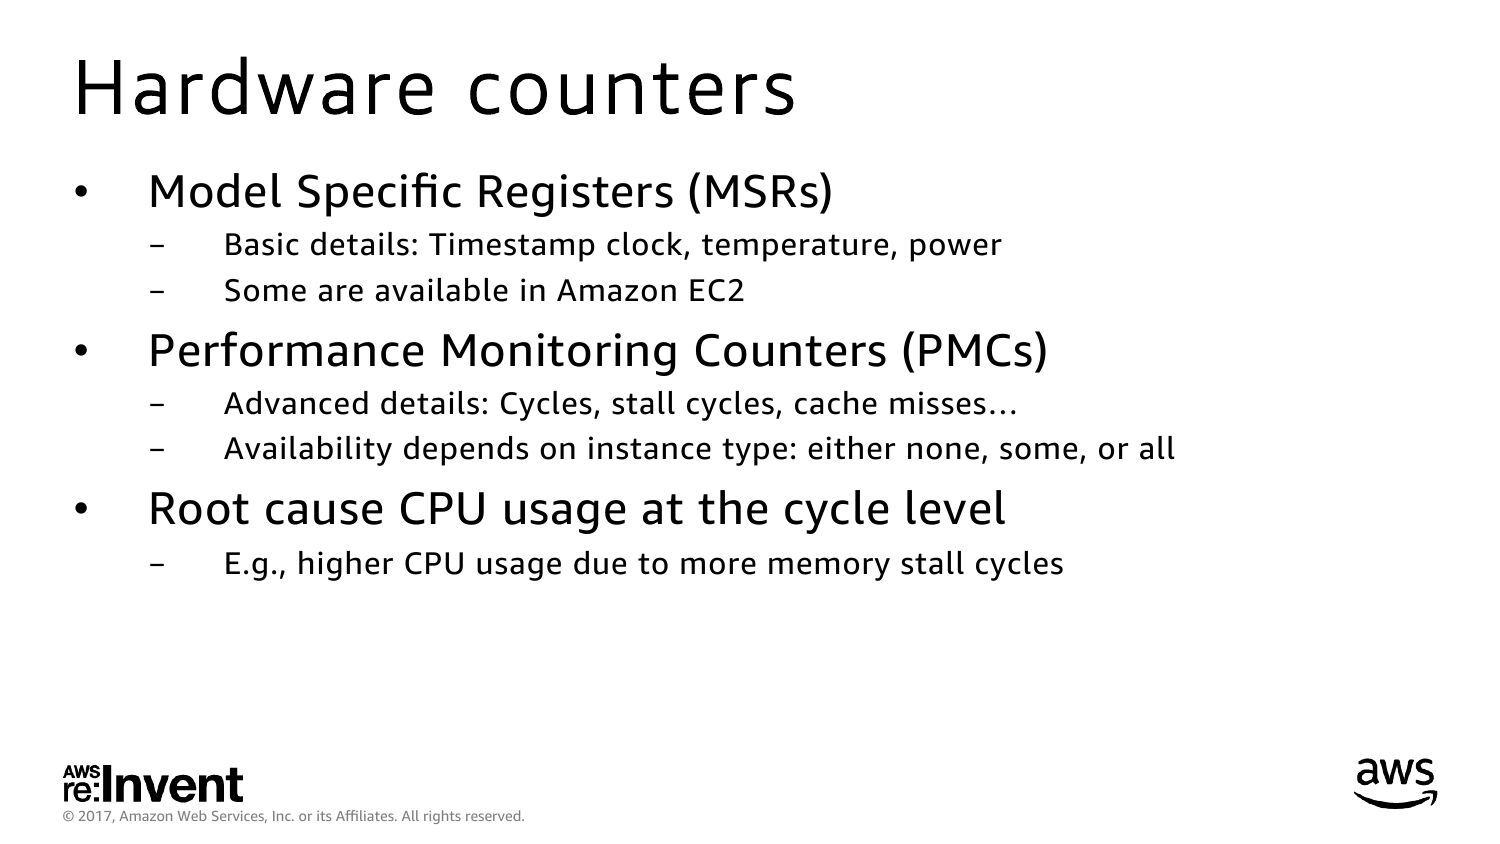
Hardware counters
Model Specific Registers (MSRs)
Performance Monitoring Counters (PMCs)
Basic details: Timestamp clock, temperature, power
Some are available in Amazon EC2
Advanced details: Cycles, stall cycles, cache misses…
Availability depends on instance type: either none, some, or all
Root cause CPU usage at the cycle level
E.g., higher CPU usage due to more memory stall cycles
© 2017, Amazon Web Services, Inc. or its Affiliates. All rights reserved.
slide 52:
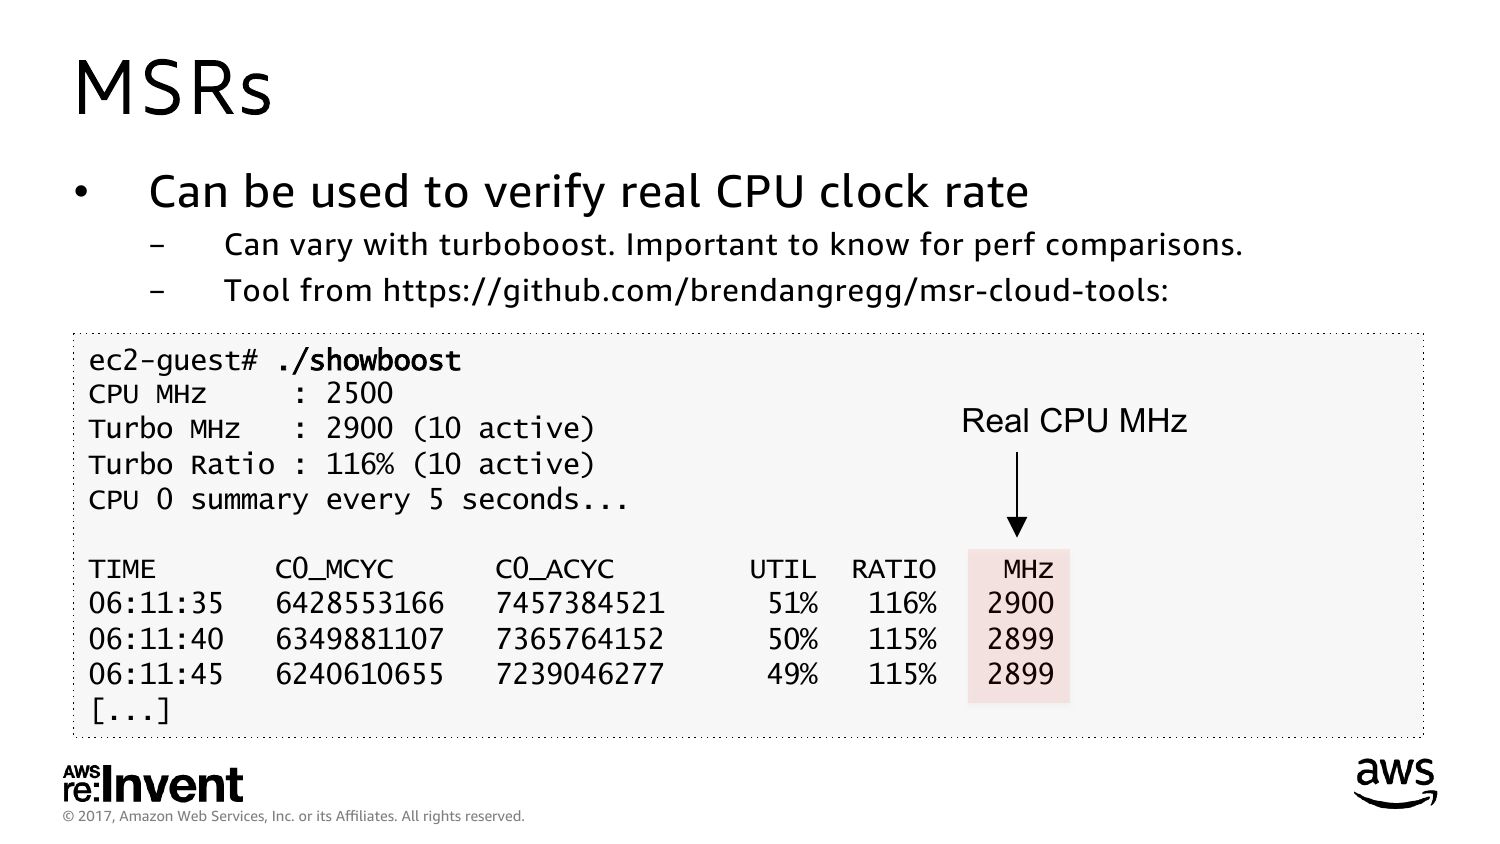
MSRs
Can be used to verify real CPU clock rate
Can vary with turboboost. Important to know for perf comparisons.
Tool from https://github.com/brendangregg/msr-cloud-tools:
ec2-guest# ./showboost
CPU MHz
: 2500
Turbo MHz
: 2900 (10 active)
Turbo Ratio : 116% (10 active)
CPU 0 summary every 5 seconds...
TIME
06:11:35
06:11:40
06:11:45
[...]
C0_MCYC
C0_ACYC
© 2017, Amazon Web Services, Inc. or its Affiliates. All rights reserved.
Real CPU MHz
UTIL
51%
50%
49%
RATIO
116%
115%
115%
MHz
slide 53:
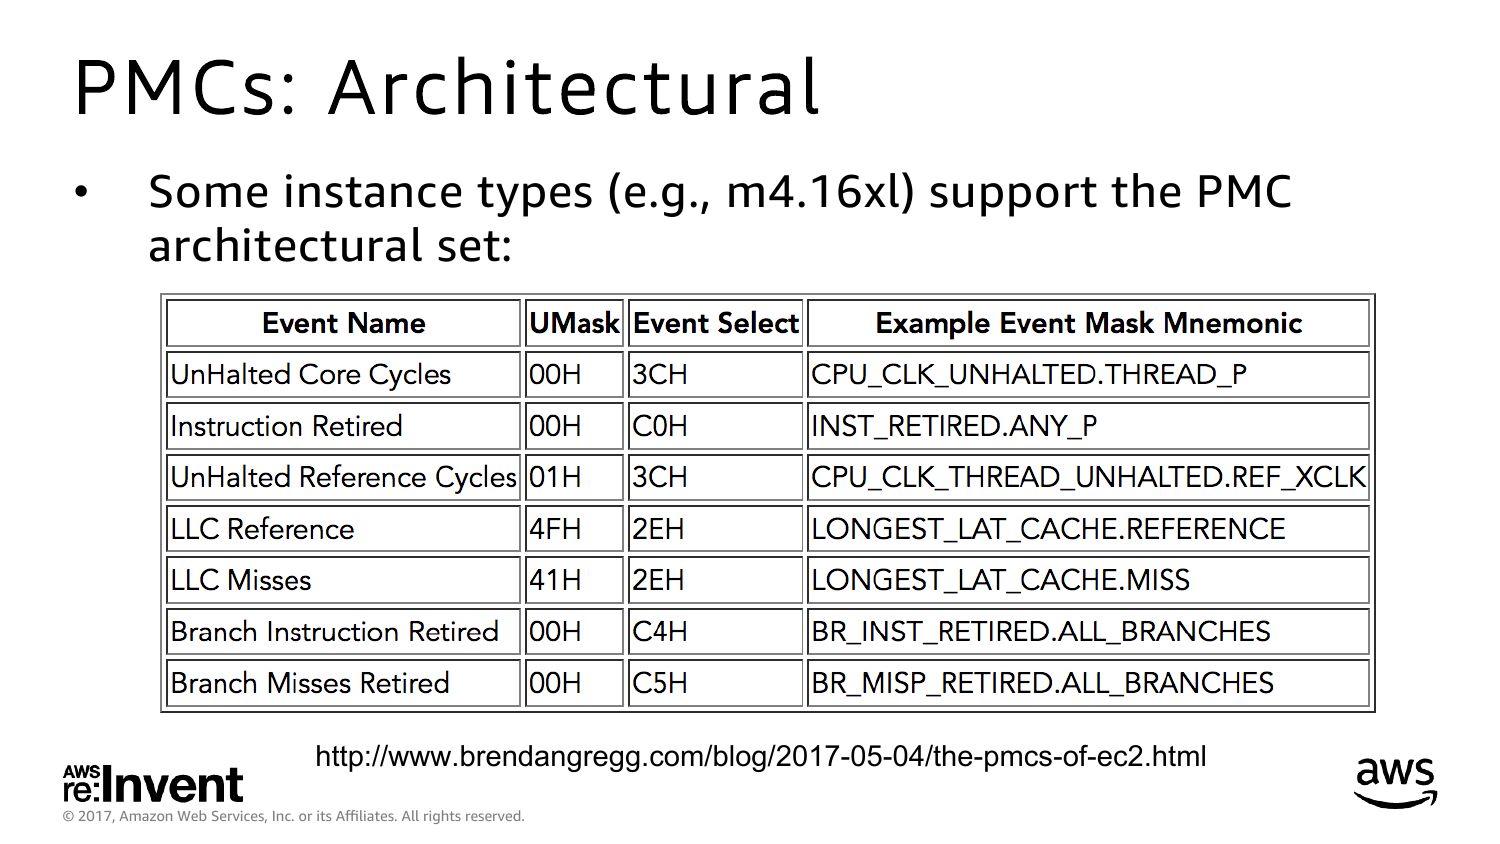
PMCs: Architectural
Some instance types (e.g., m4.16xl) support the PMC
architectural set:
http://www.brendangregg.com/blog/2017-05-04/the-pmcs-of-ec2.html
© 2017, Amazon Web Services, Inc. or its Affiliates. All rights reserved.
slide 54:
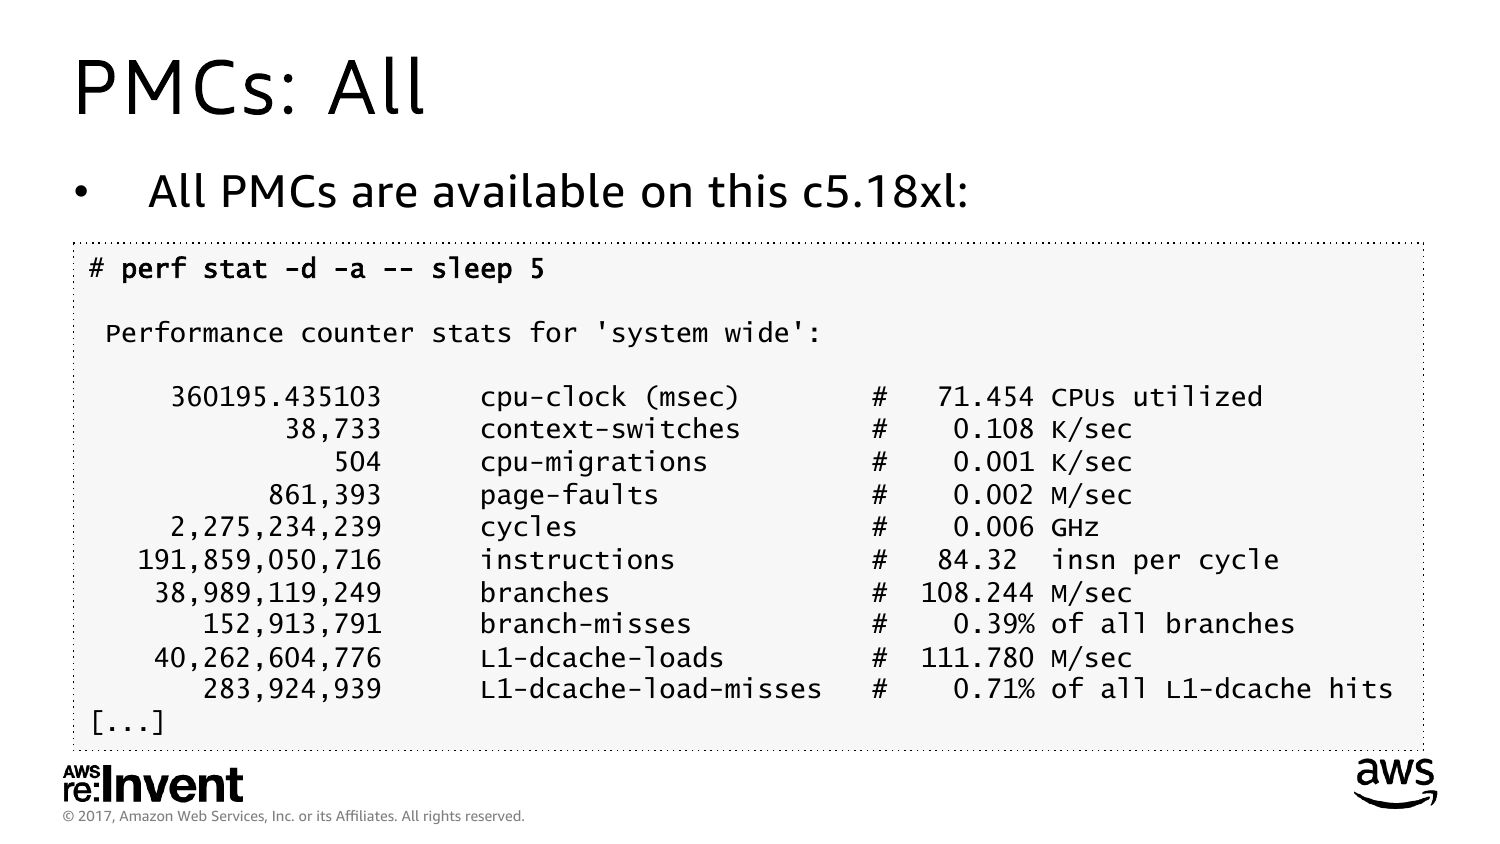
PMCs: All
All PMCs are available on this c5.18xl:
# perf stat -d -a -- sleep 5
Performance counter stats for 'system wide':
38,733
861,393
2,275,234,239
191,859,050,716
38,989,119,249
152,913,791
40,262,604,776
283,924,939
[...]
cpu-clock (msec)
context-switches
cpu-migrations
page-faults
cycles
instructions
branches
branch-misses
L1-dcache-loads
L1-dcache-load-misses
© 2017, Amazon Web Services, Inc. or its Affiliates. All rights reserved.
71.454 CPUs utilized
0.108 K/sec
0.001 K/sec
0.002 M/sec
0.006 GHz
84.32 insn per cycle
108.244 M/sec
0.39% of all branches
111.780 M/sec
0.71% of all L1-dcache hits
slide 55:
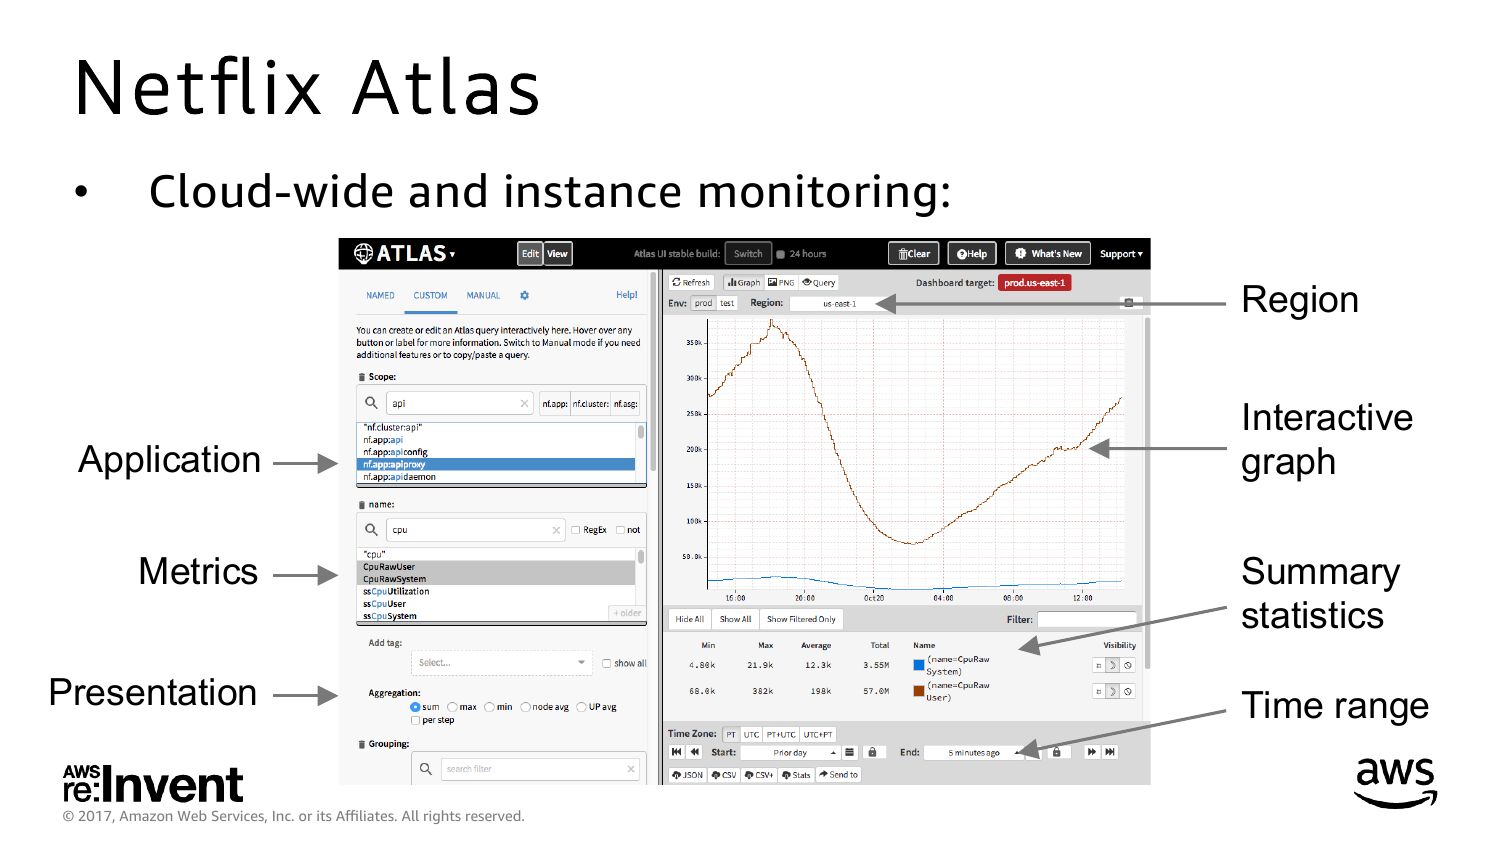
Netflix Atlas
Cloud-wide and instance monitoring:
Region
Application
Metrics
Presentation
© 2017, Amazon Web Services, Inc. or its Affiliates. All rights reserved.
Interactive
graph
Summary
statistics
Time range
slide 56:
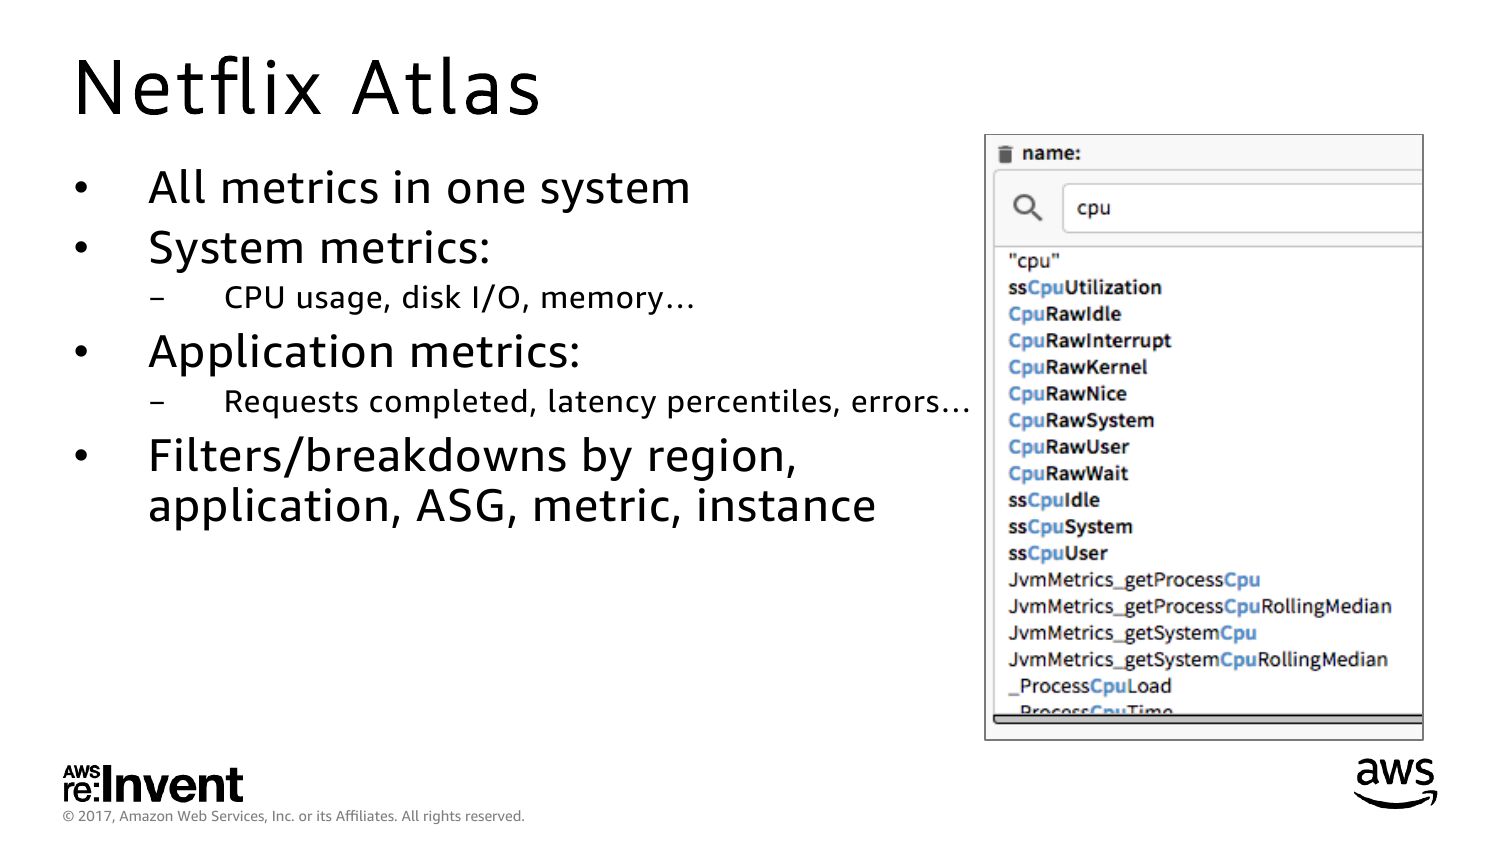
Netflix Atlas
All metrics in one system
System metrics:
Application metrics:
CPU usage, disk I/O, memory…
Requests completed, latency percentiles, errors…
Filters/breakdowns by region,
application, ASG, metric, instance
© 2017, Amazon Web Services, Inc. or its Affiliates. All rights reserved.
slide 57:
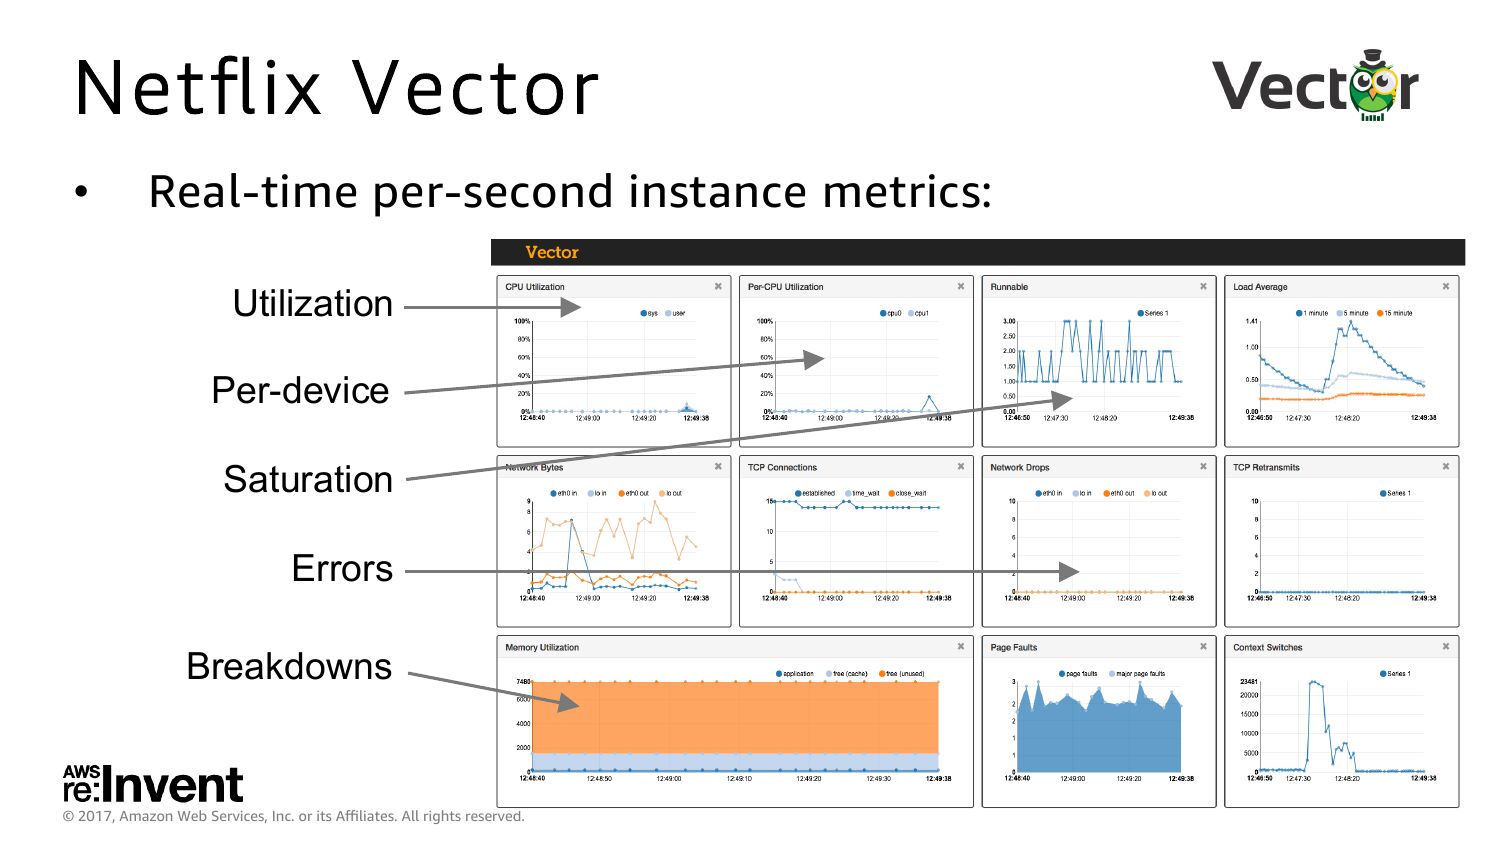
Netflix Vector
Real-time per-second instance metrics:
Utilization
Per-device
Saturation
Errors
Breakdowns
© 2017, Amazon Web Services, Inc. or its Affiliates. All rights reserved.
slide 58:
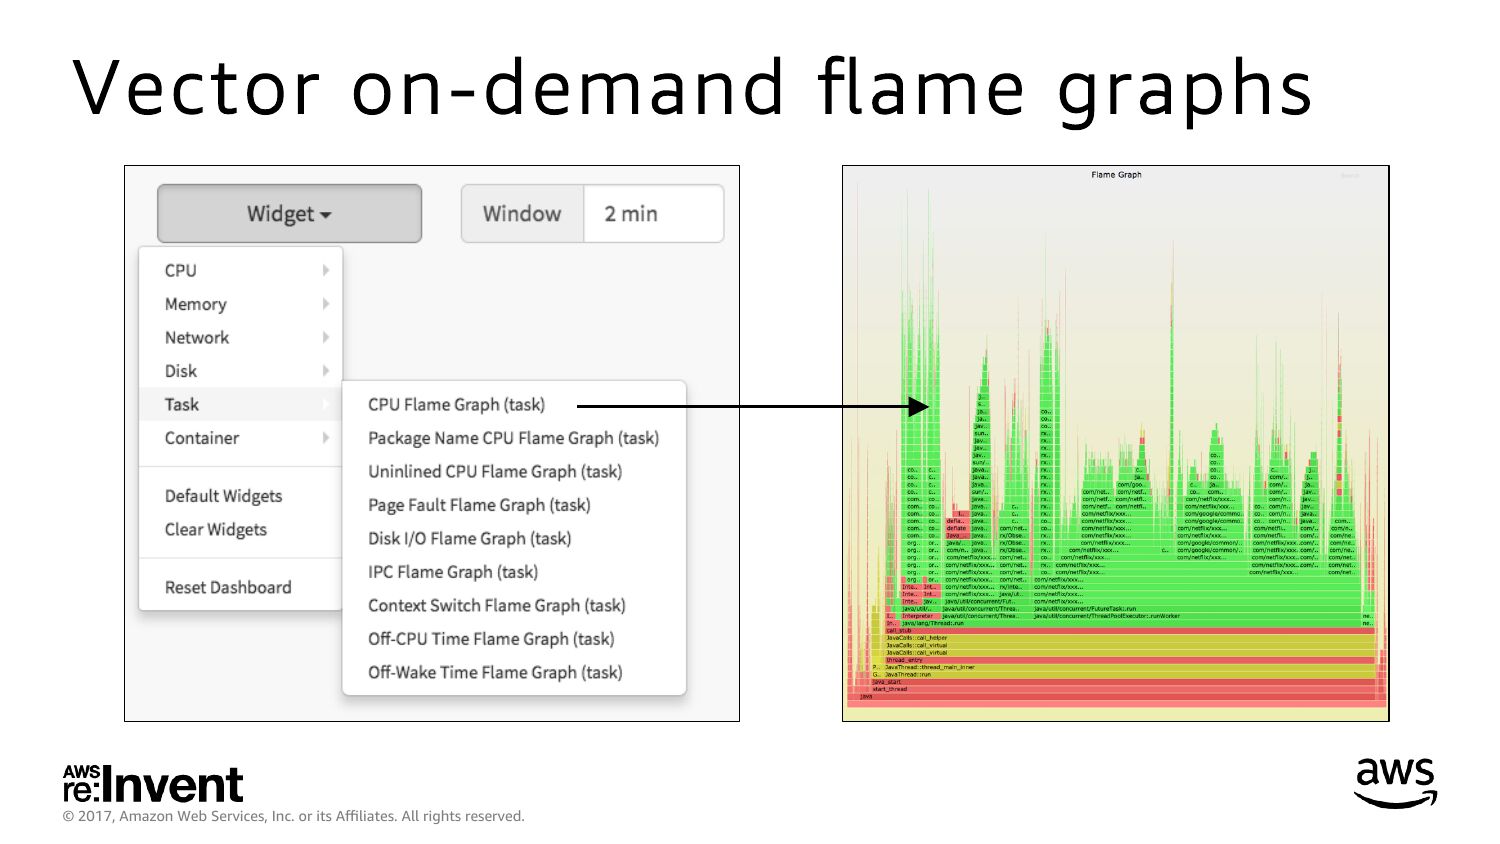
Vector on-demand flame graphs
© 2017, Amazon Web Services, Inc. or its Affiliates. All rights reserved.
slide 59:
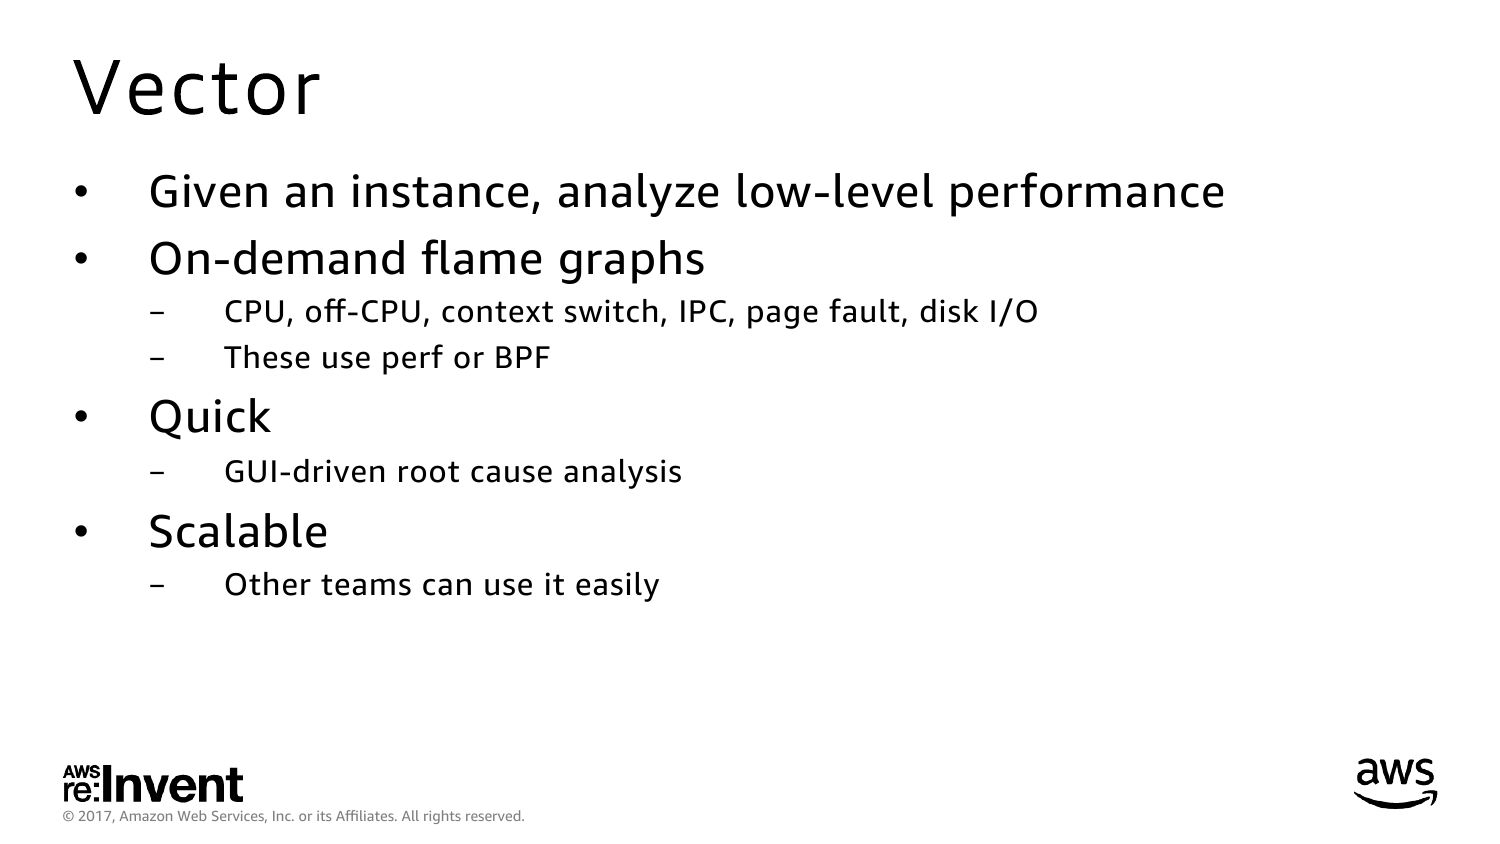
Vector
Given an instance, analyze low-level performance
On-demand flame graphs
Quick
CPU, off-CPU, context switch, IPC, page fault, disk I/O
These use perf or BPF
GUI-driven root cause analysis
Scalable
Other teams can use it easily
© 2017, Amazon Web Services, Inc. or its Affiliates. All rights reserved.
slide 60:
Summary
Instance selection
Amazon EC2 features
Kernel tuning
Methodologies
Observability
© 2017, Amazon Web Services, Inc. or its Affiliates. All rights reserved.
slide 61:
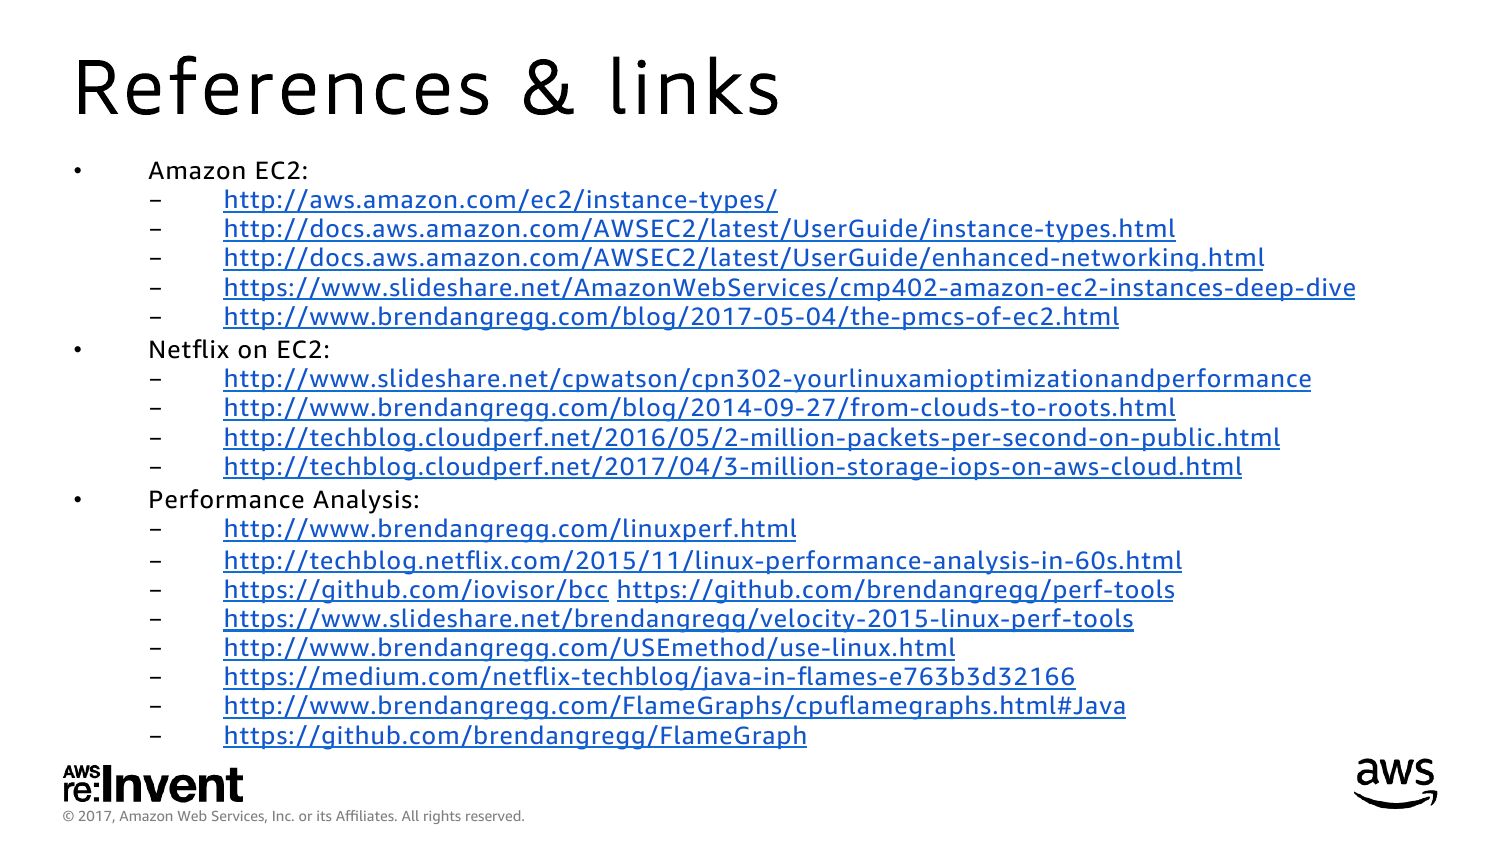
References & links
Amazon EC2:
http://aws.amazon.com/ec2/instance-types/
http://docs.aws.amazon.com/AWSEC2/latest/UserGuide/instance-types.html
http://docs.aws.amazon.com/AWSEC2/latest/UserGuide/enhanced-networking.html
https://www.slideshare.net/AmazonWebServices/cmp402-amazon-ec2-instances-deep-dive
http://www.brendangregg.com/blog/2017-05-04/the-pmcs-of-ec2.html
Netflix on EC2:
http://www.slideshare.net/cpwatson/cpn302-yourlinuxamioptimizationandperformance
http://www.brendangregg.com/blog/2014-09-27/from-clouds-to-roots.html
http://techblog.cloudperf.net/2016/05/2-million-packets-per-second-on-public.html
http://techblog.cloudperf.net/2017/04/3-million-storage-iops-on-aws-cloud.html
Performance Analysis:
http://www.brendangregg.com/linuxperf.html
http://techblog.netflix.com/2015/11/linux-performance-analysis-in-60s.html
https://github.com/iovisor/bcc https://github.com/brendangregg/perf-tools
https://www.slideshare.net/brendangregg/velocity-2015-linux-perf-tools
http://www.brendangregg.com/USEmethod/use-linux.html
https://medium.com/netflix-techblog/java-in-flames-e763b3d32166
http://www.brendangregg.com/FlameGraphs/cpuflamegraphs.html#Java
https://github.com/brendangregg/FlameGraph
© 2017, Amazon Web Services, Inc. or its Affiliates. All rights reserved.
slide 62:
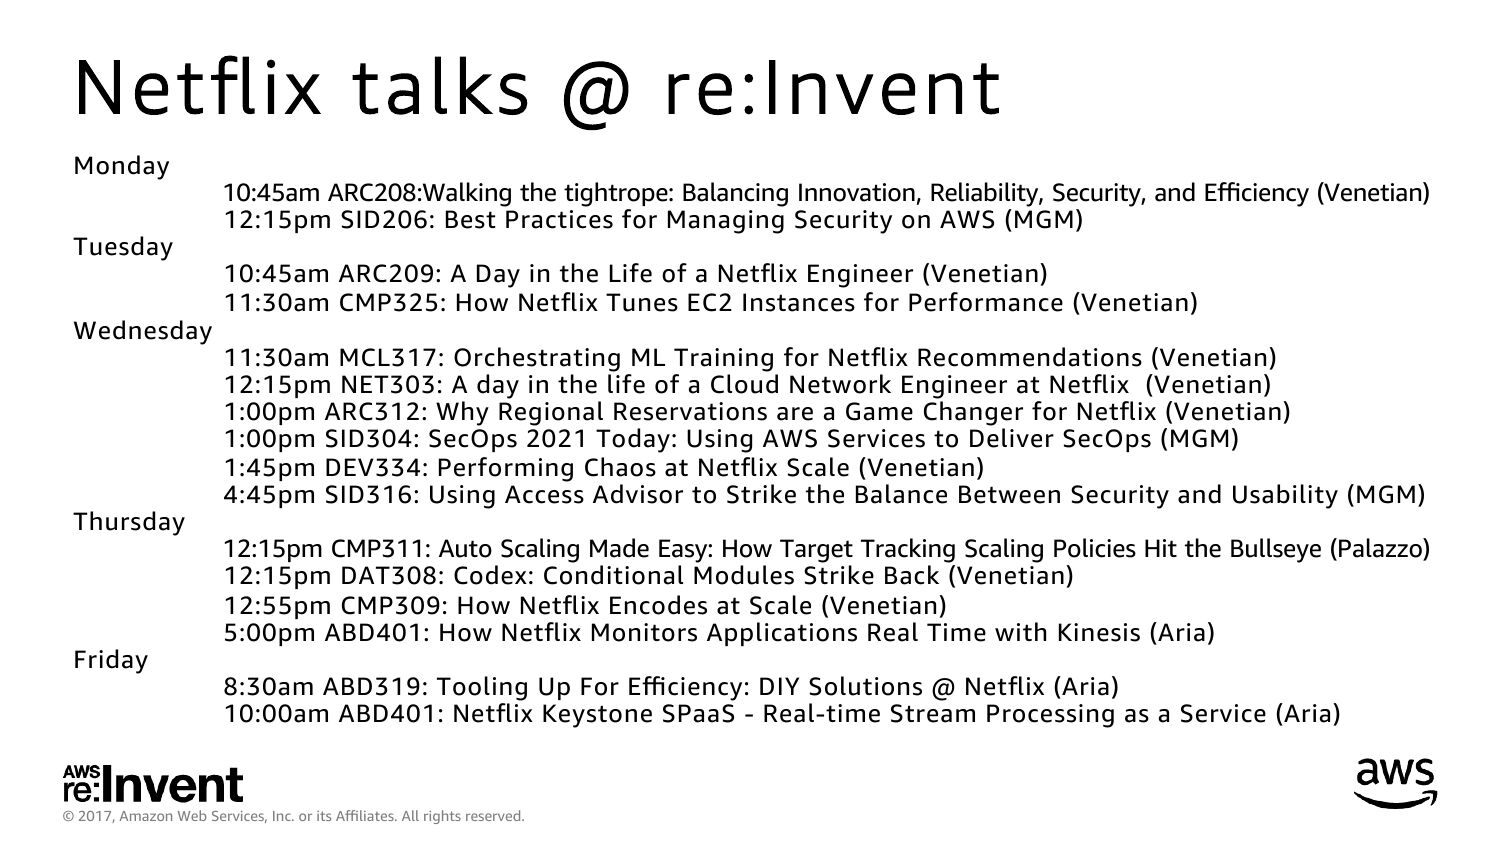
Netflix talks @ re:Invent
Monday
Tuesday
Wednesday
Thursday
Friday
10:45am ARC208:Walking the tightrope: Balancing Innovation, Reliability, Security, and Efficiency (Venetian)
12:15pm SID206: Best Practices for Managing Security on AWS (MGM)
10:45am ARC209: A Day in the Life of a Netflix Engineer (Venetian)
11:30am CMP325: How Netflix Tunes EC2 Instances for Performance (Venetian)
11:30am MCL317: Orchestrating ML Training for Netflix Recommendations (Venetian)
12:15pm NET303: A day in the life of a Cloud Network Engineer at Netflix (Venetian)
1:00pm ARC312: Why Regional Reservations are a Game Changer for Netflix (Venetian)
1:00pm SID304: SecOps 2021 Today: Using AWS Services to Deliver SecOps (MGM)
1:45pm DEV334: Performing Chaos at Netflix Scale (Venetian)
4:45pm SID316: Using Access Advisor to Strike the Balance Between Security and Usability (MGM)
12:15pm CMP311: Auto Scaling Made Easy: How Target Tracking Scaling Policies Hit the Bullseye (Palazzo)
12:15pm DAT308: Codex: Conditional Modules Strike Back (Venetian)
12:55pm CMP309: How Netflix Encodes at Scale (Venetian)
5:00pm ABD401: How Netflix Monitors Applications Real Time with Kinesis (Aria)
8:30am ABD319: Tooling Up For Efficiency: DIY Solutions @ Netflix (Aria)
10:00am ABD401: Netflix Keystone SPaaS - Real-time Stream Processing as a Service (Aria)
© 2017, Amazon Web Services, Inc. or its Affiliates. All rights reserved.
slide 63:
CMP325
Thank you!
B r e n d a n G r e g g , N e t fl i x P e r f o r m a n c e a n d O p e r a t i n g S y s t e m s T e a m
@brendangregg
© 2017, Amazon Web Services, Inc. or its Affiliates. All rights reserved.


