EuroBSDcon 2017: System Performance Analysis Methodologies
Video: https://www.youtube.com/watch?v=ay41Uq1DrvMKeynote by Brendan Gregg.
Description: "Traditional performance monitoring makes do with vendor-supplied metrics, often involving interpretation and inference, and with numerous blind spots. Much in the field of systems performance is still living in the past: documentation, procedures, and analysis GUIs built upon the same old metrics. Modern BSD has advanced tracers and PMC tools, providing virtually endless metrics to aid performance analysis. It's time we really used them, but the problem becomes which metrics to use, and how to navigate them quickly to locate the root cause of problems.
There's a new way to approach performance analysis that can guide you through the metrics. Instead of starting with traditional metrics and figuring out their use, you start with the questions you want answered then look for metrics to answer them. Methodologies can provide these questions, as well as a starting point for analysis and guidance for locating the root cause. They also pose questions that the existing metrics may not yet answer, which may be critical in solving the toughest problems. System methodologies include the USE method, workload characterization, drill-down analysis, off-CPU analysis, chain graphs, and more.
This talk will discuss various system performance issues, and the methodologies, tools, and processes used to solve them. Many methodologies will be discussed, from the production proven to the cutting edge, along with recommendations for their implementation on BSD systems. In general, you will learn to think differently about analyzing your systems, and make better use of the modern tools that BSD provides."
| next prev 1/65 | |
| next prev 2/65 | |
| next prev 3/65 | |
| next prev 4/65 | |
| next prev 5/65 | |
| next prev 6/65 | |
| next prev 7/65 | |
| next prev 8/65 | |
| next prev 9/65 | |
| next prev 10/65 | |
| next prev 11/65 | |
| next prev 12/65 | |
| next prev 13/65 | |
| next prev 14/65 | |
| next prev 15/65 | |
| next prev 16/65 | |
| next prev 17/65 | |
| next prev 18/65 | |
| next prev 19/65 | |
| next prev 20/65 | |
| next prev 21/65 | |
| next prev 22/65 | |
| next prev 23/65 | |
| next prev 24/65 | |
| next prev 25/65 | |
| next prev 26/65 | |
| next prev 27/65 | |
| next prev 28/65 | |
| next prev 29/65 | |
| next prev 30/65 | |
| next prev 31/65 | |
| next prev 32/65 | |
| next prev 33/65 | |
| next prev 34/65 | |
| next prev 35/65 | |
| next prev 36/65 | |
| next prev 37/65 | |
| next prev 38/65 | |
| next prev 39/65 | |
| next prev 40/65 | |
| next prev 41/65 | |
| next prev 42/65 | |
| next prev 43/65 | |
| next prev 44/65 | |
| next prev 45/65 | |
| next prev 46/65 | |
| next prev 47/65 | |
| next prev 48/65 | |
| next prev 49/65 | |
| next prev 50/65 | |
| next prev 51/65 | |
| next prev 52/65 | |
| next prev 53/65 | |
| next prev 54/65 | |
| next prev 55/65 | |
| next prev 56/65 | |
| next prev 57/65 | |
| next prev 58/65 | |
| next prev 59/65 | |
| next prev 60/65 | |
| next prev 61/65 | |
| next prev 62/65 | |
| next prev 63/65 | |
| next prev 64/65 | |
| next prev 65/65 |
PDF: EuroBSDcon2017_SystemMethodology.pdf
Keywords (from pdftotext):
slide 1:
EuroBSDcon 2017
System Performance
Analysis Methodologies
Brendan Gregg
Senior Performance Architect
slide 2:
slide 3:
Apollo Lunar Module Guidance Computer
performance analysis
CORE SET
AREA
VAC SETS
ERASABLE
MEMORY
FIXED
MEMORY
slide 4:
slide 5:
Backgroundslide 6:
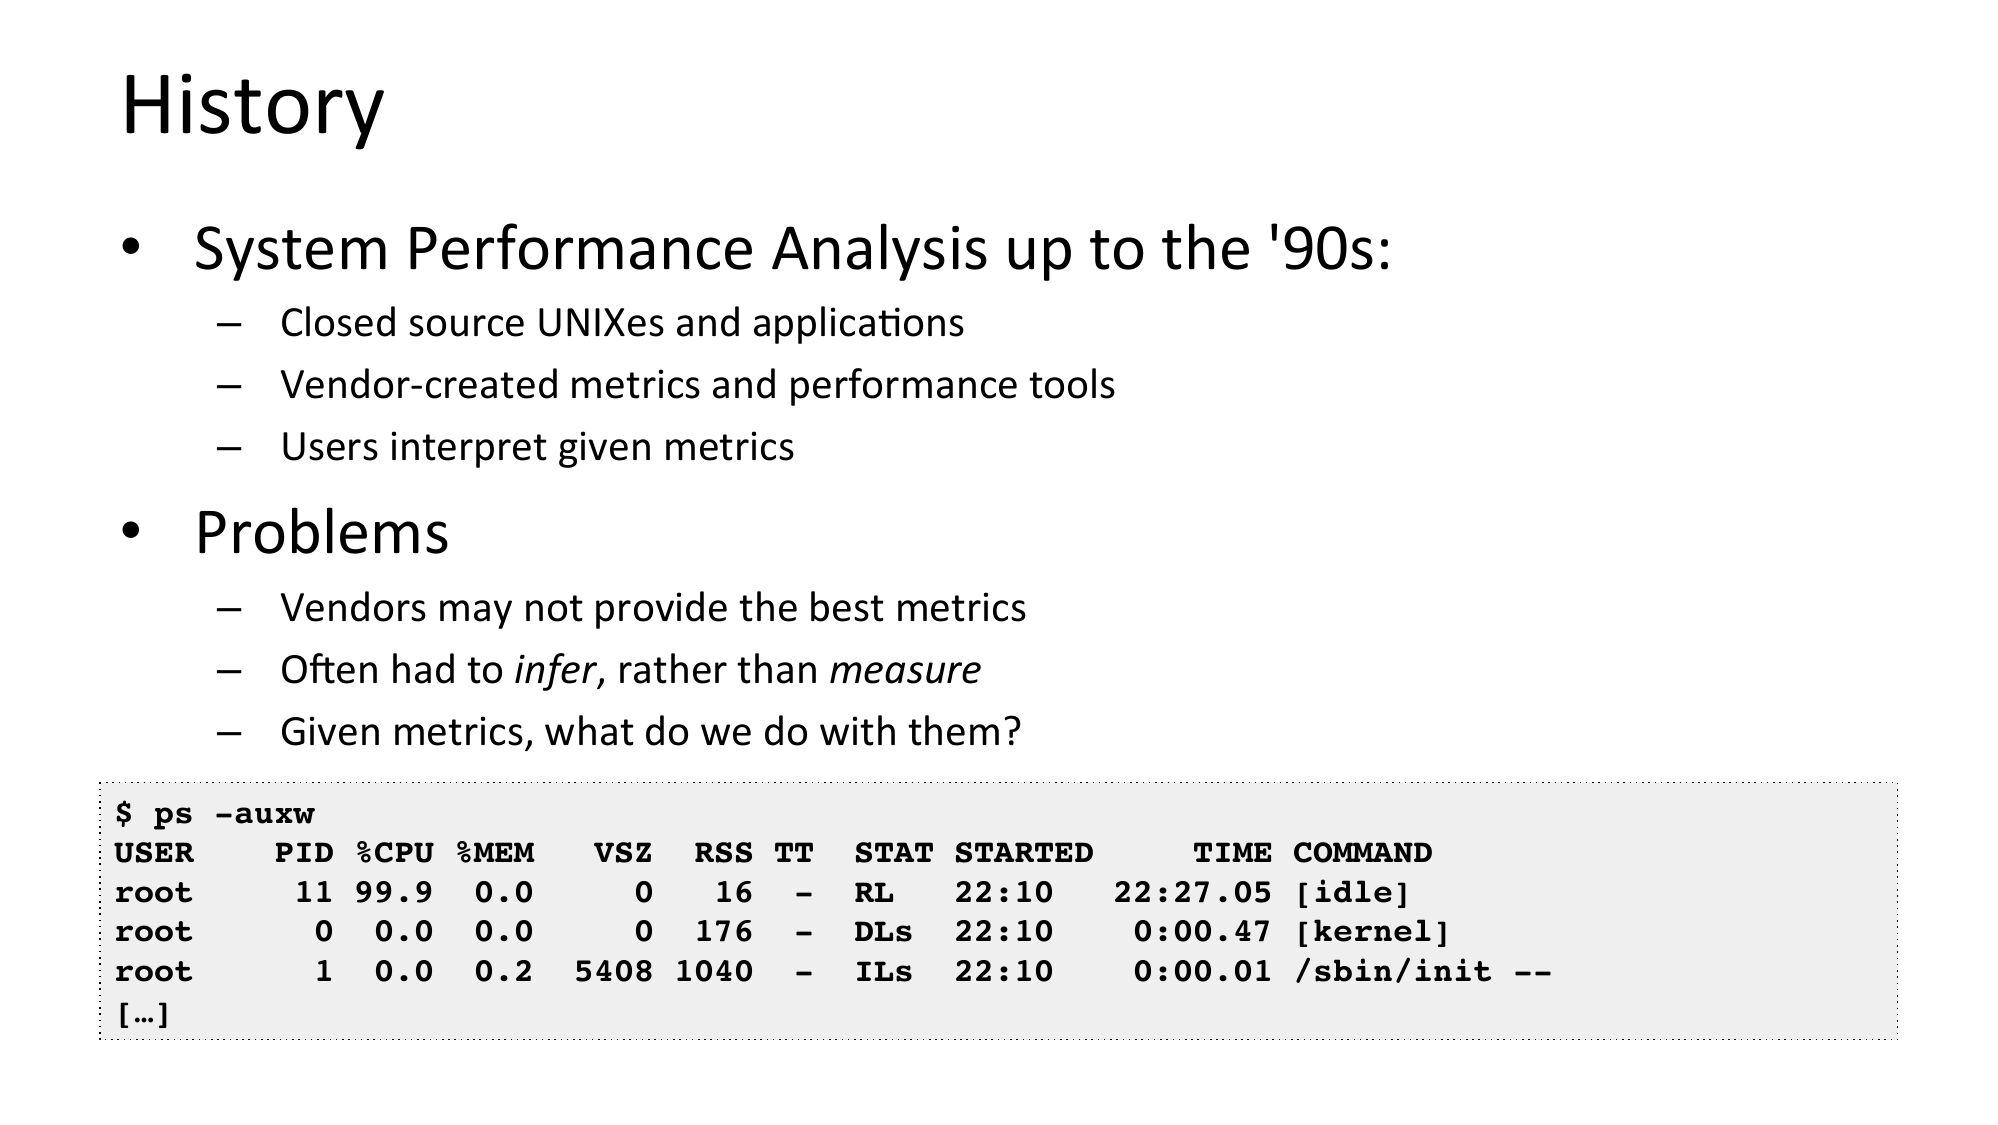
History
• System Performance Analysis up to the '90s:
– Closed source UNIXes and applicaNons
– Vendor-created metrics and performance tools
– Users interpret given metrics
• Problems
– Vendors may not provide the best metrics
– ORen had to infer, rather than measure
– Given metrics, what do we do with them?
$ ps -auxw
USER
PID %CPU %MEM
root
11 99.9 0.0
root
0 0.0 0.0
root
1 0.0 0.2
[…]
VSZ RSS TT
16 0 176 5408 1040 -
STAT STARTED
TIME COMMAND
22:10
22:27.05 [idle]
DLs 22:10
0:00.47 [kernel]
ILs 22:10
0:00.01 /sbin/init --
slide 7:
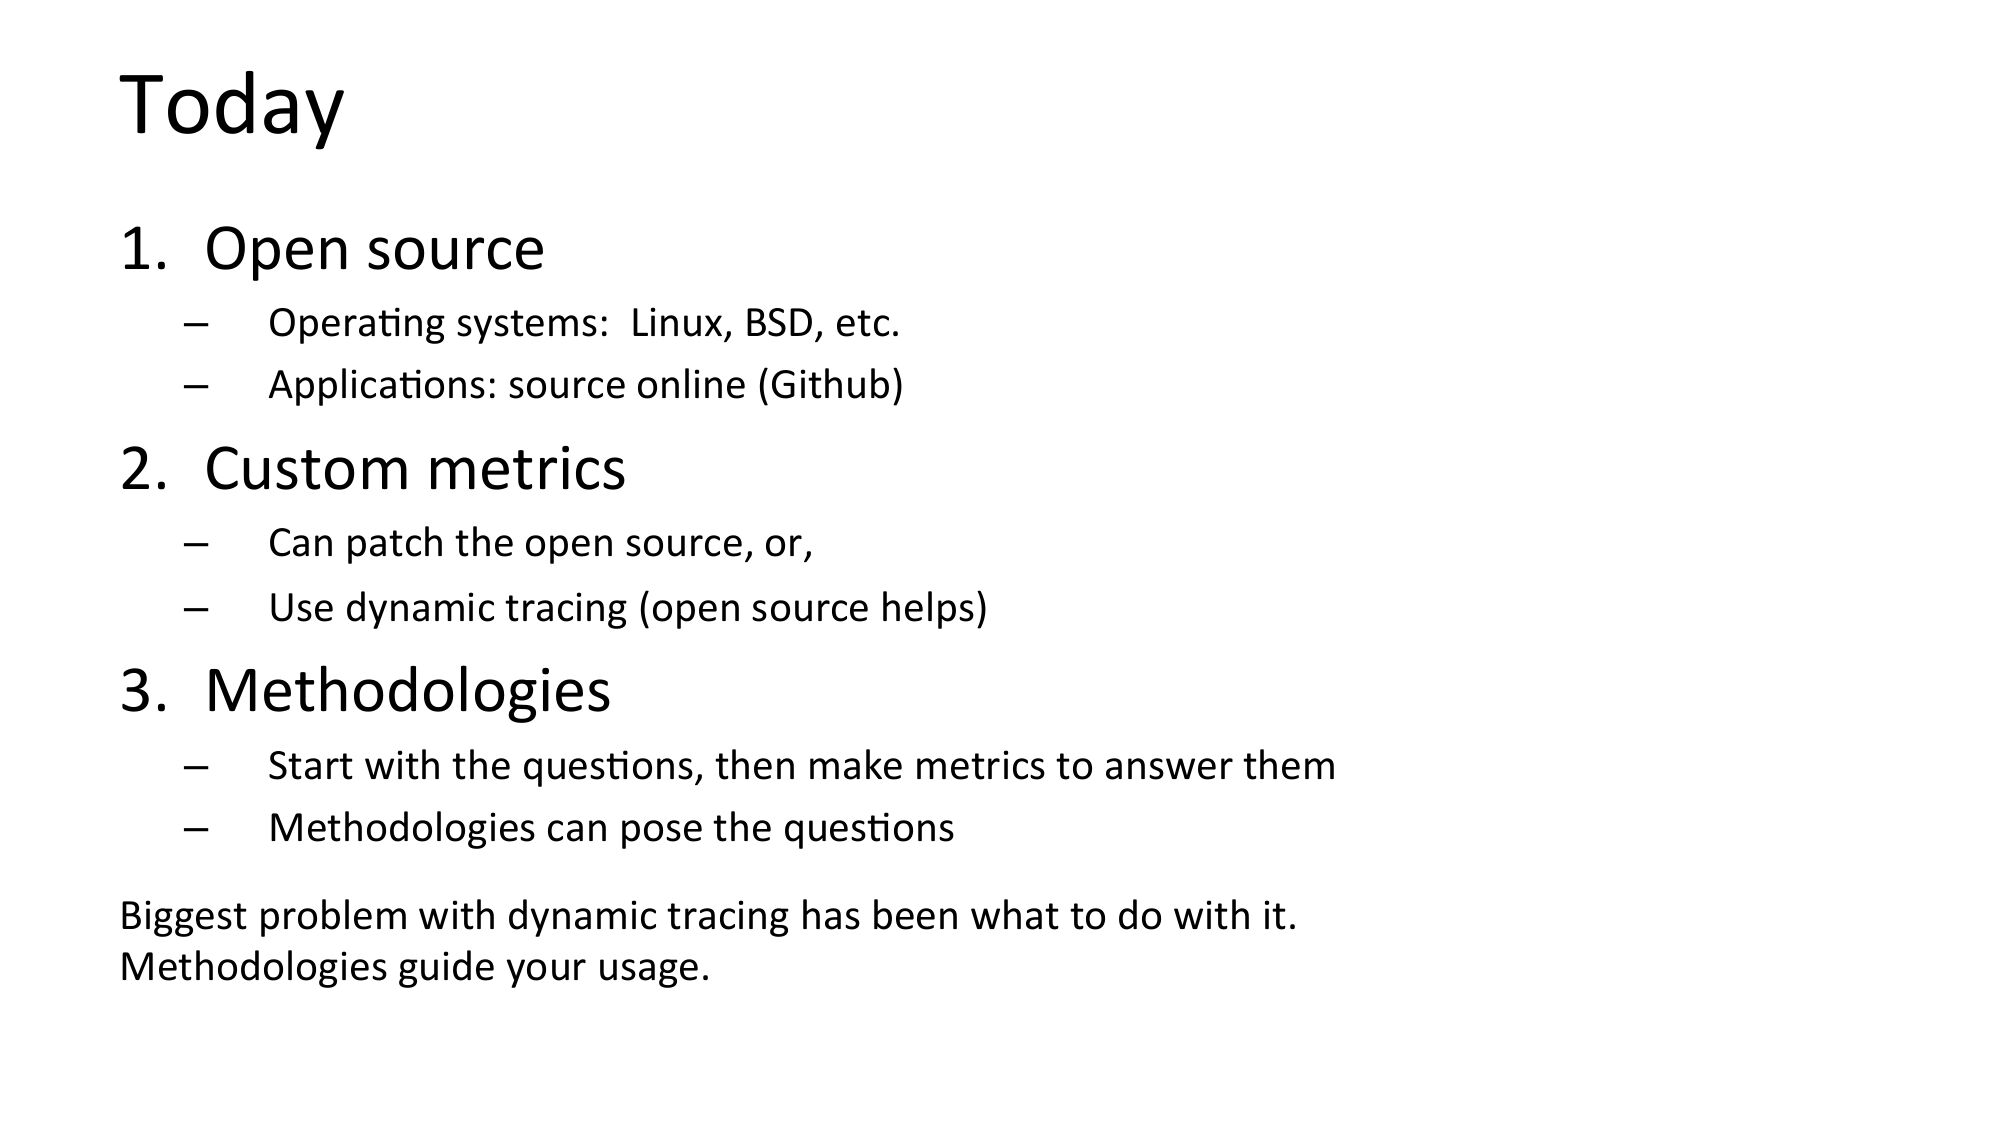
Today
1. Open source
OperaNng systems: Linux, BSD, etc.
ApplicaNons: source online (Github)
2. Custom metrics
Can patch the open source, or,
Use dynamic tracing (open source helps)
3. Methodologies
Start with the quesNons, then make metrics to answer them
Methodologies can pose the quesNons
Biggest problem with dynamic tracing has been what to do with it.
Methodologies guide your usage.
slide 8:
Crystal Ball Thinkingslide 9:
An2-Methodologiesslide 10:
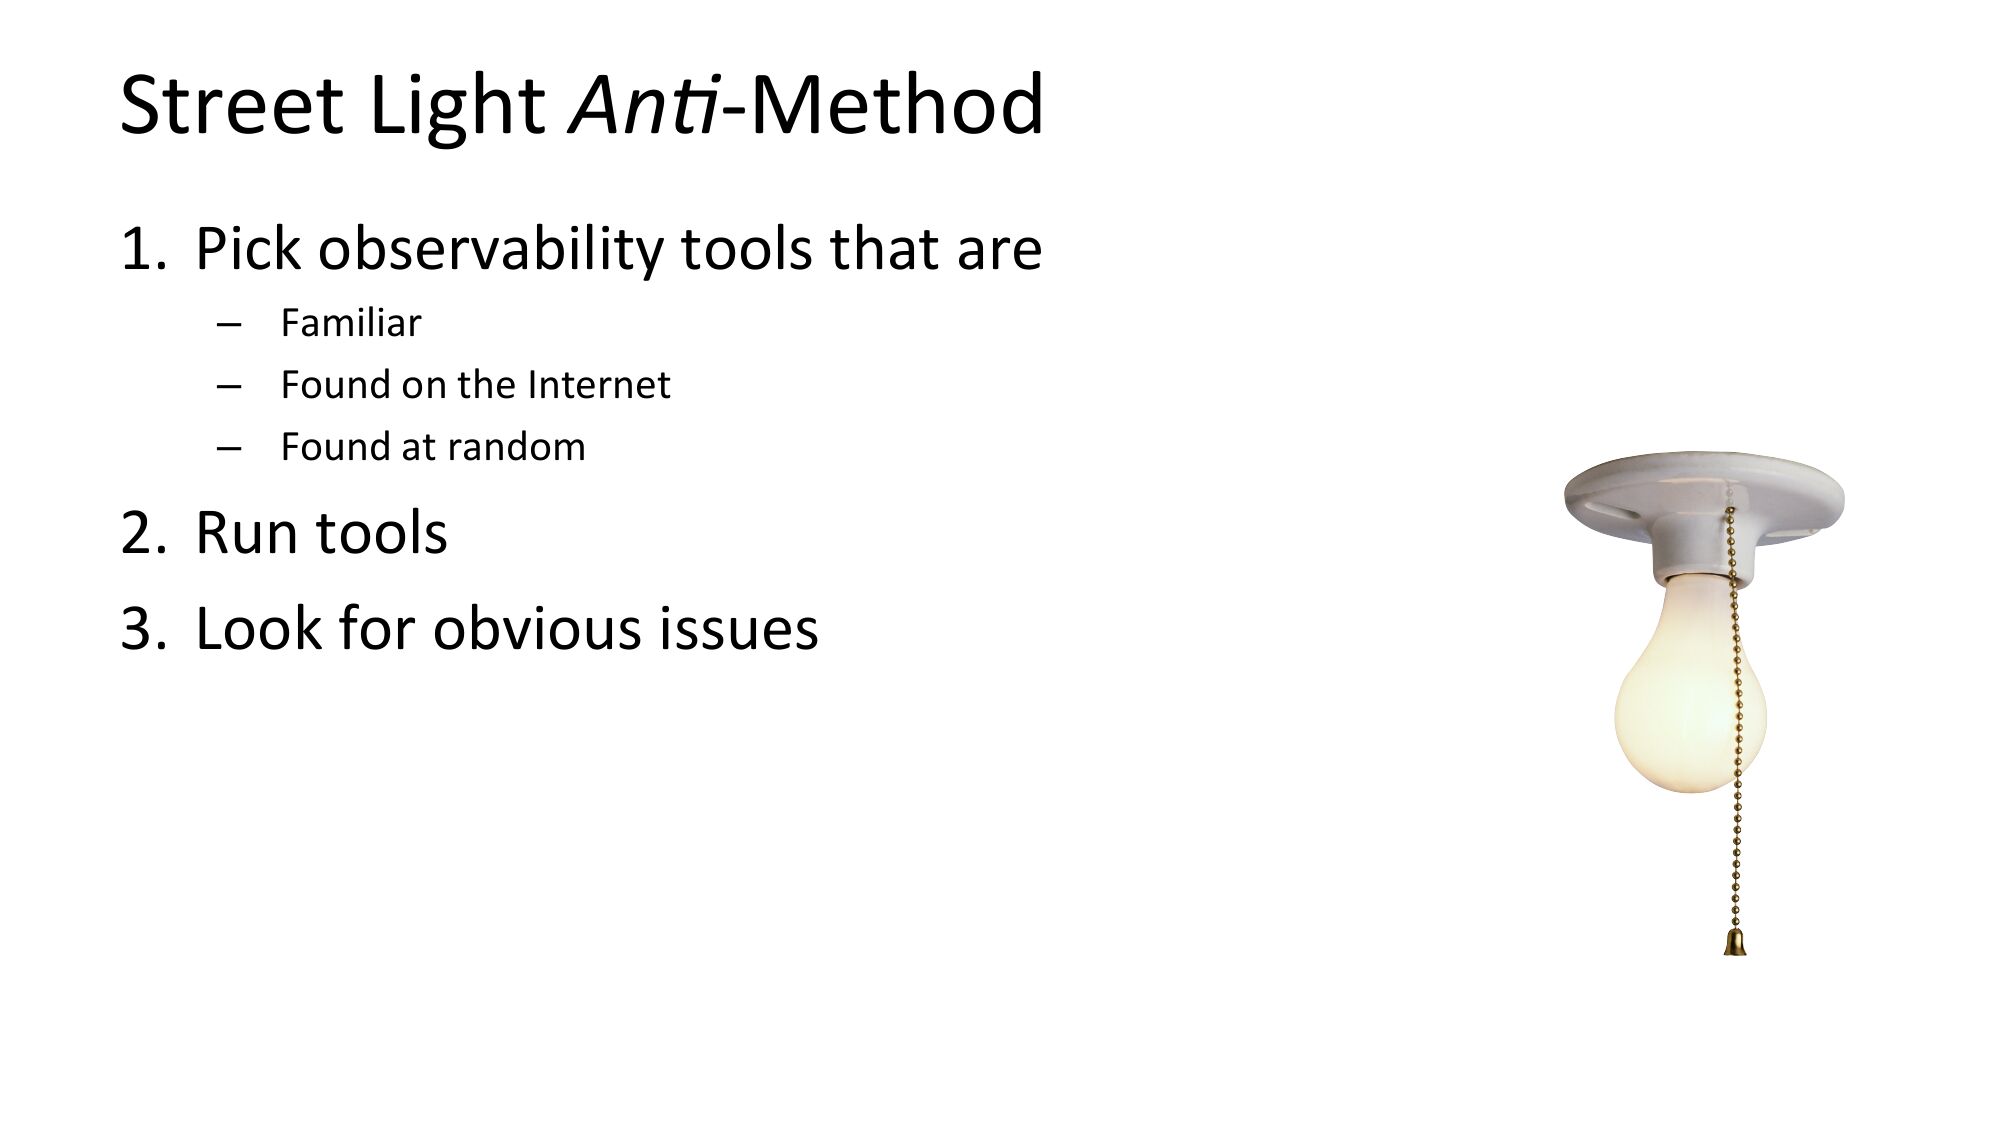
Street Light An2-Method
1. Pick observability tools that are
– Familiar
– Found on the Internet
– Found at random
2. Run tools
3. Look for obvious issues
slide 11:
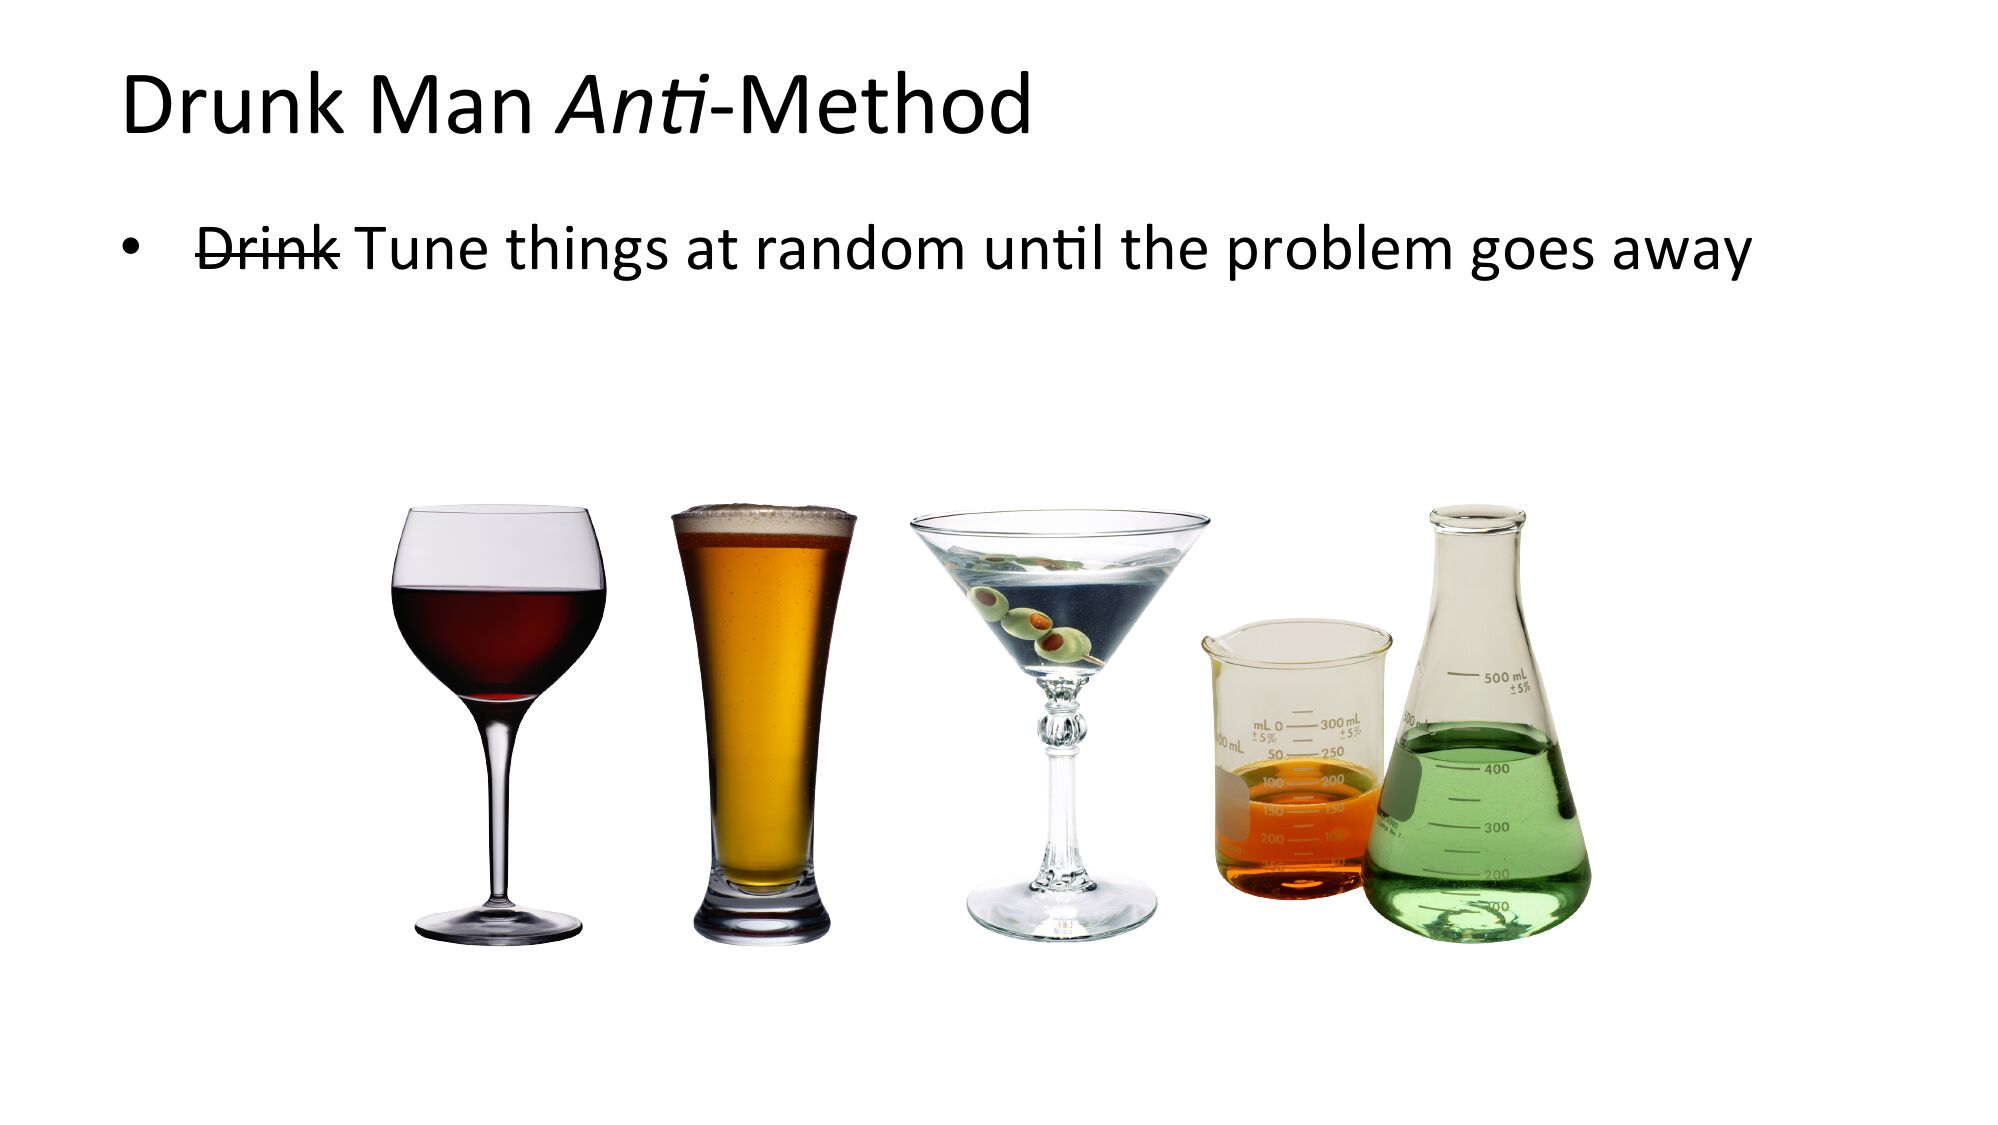
Drunk Man An2-Method
• Drink Tune things at random unNl the problem goes away
slide 12:
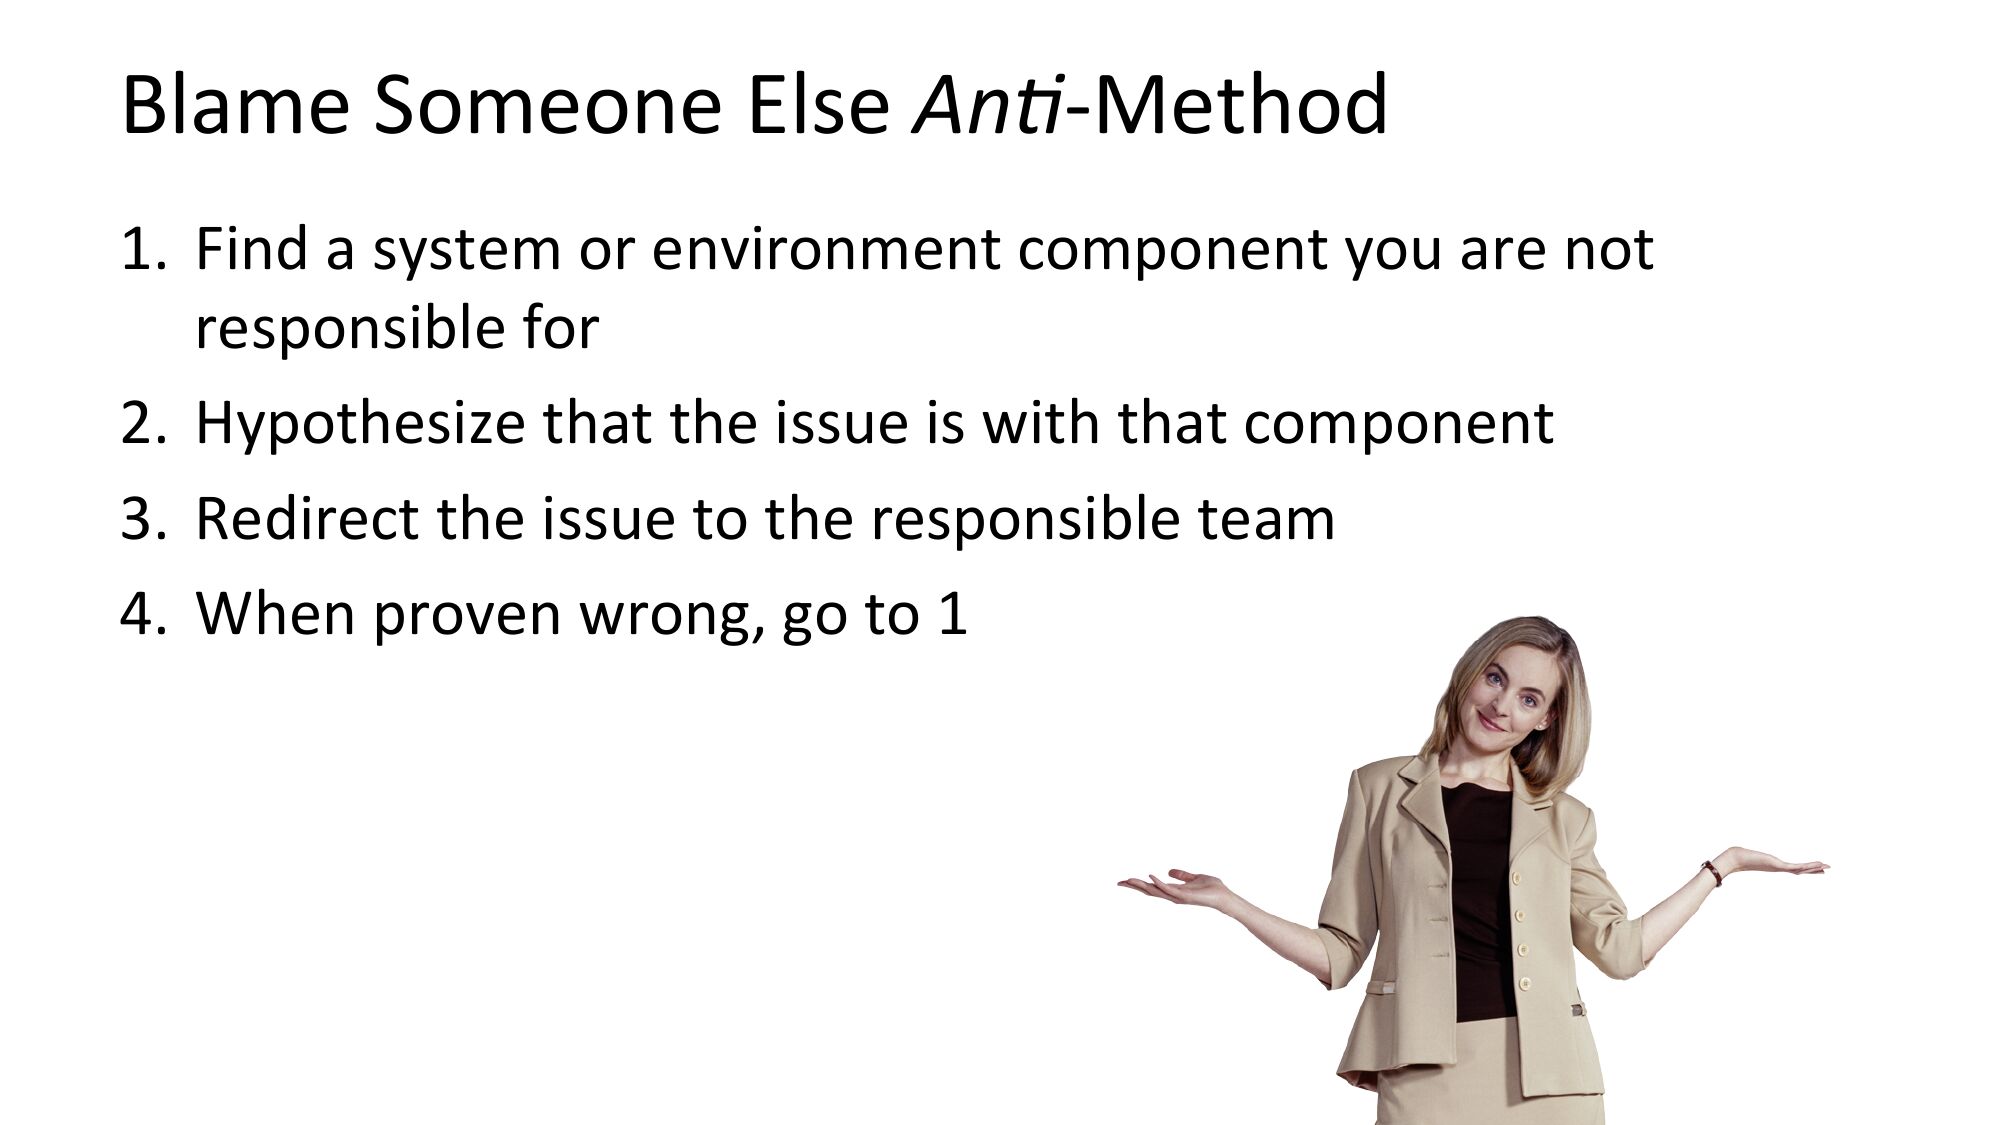
Blame Someone Else An2-Method
1. Find a system or environment component you are not
responsible for
2. Hypothesize that the issue is with that component
3. Redirect the issue to the responsible team
4. When proven wrong, go to 1
slide 13:
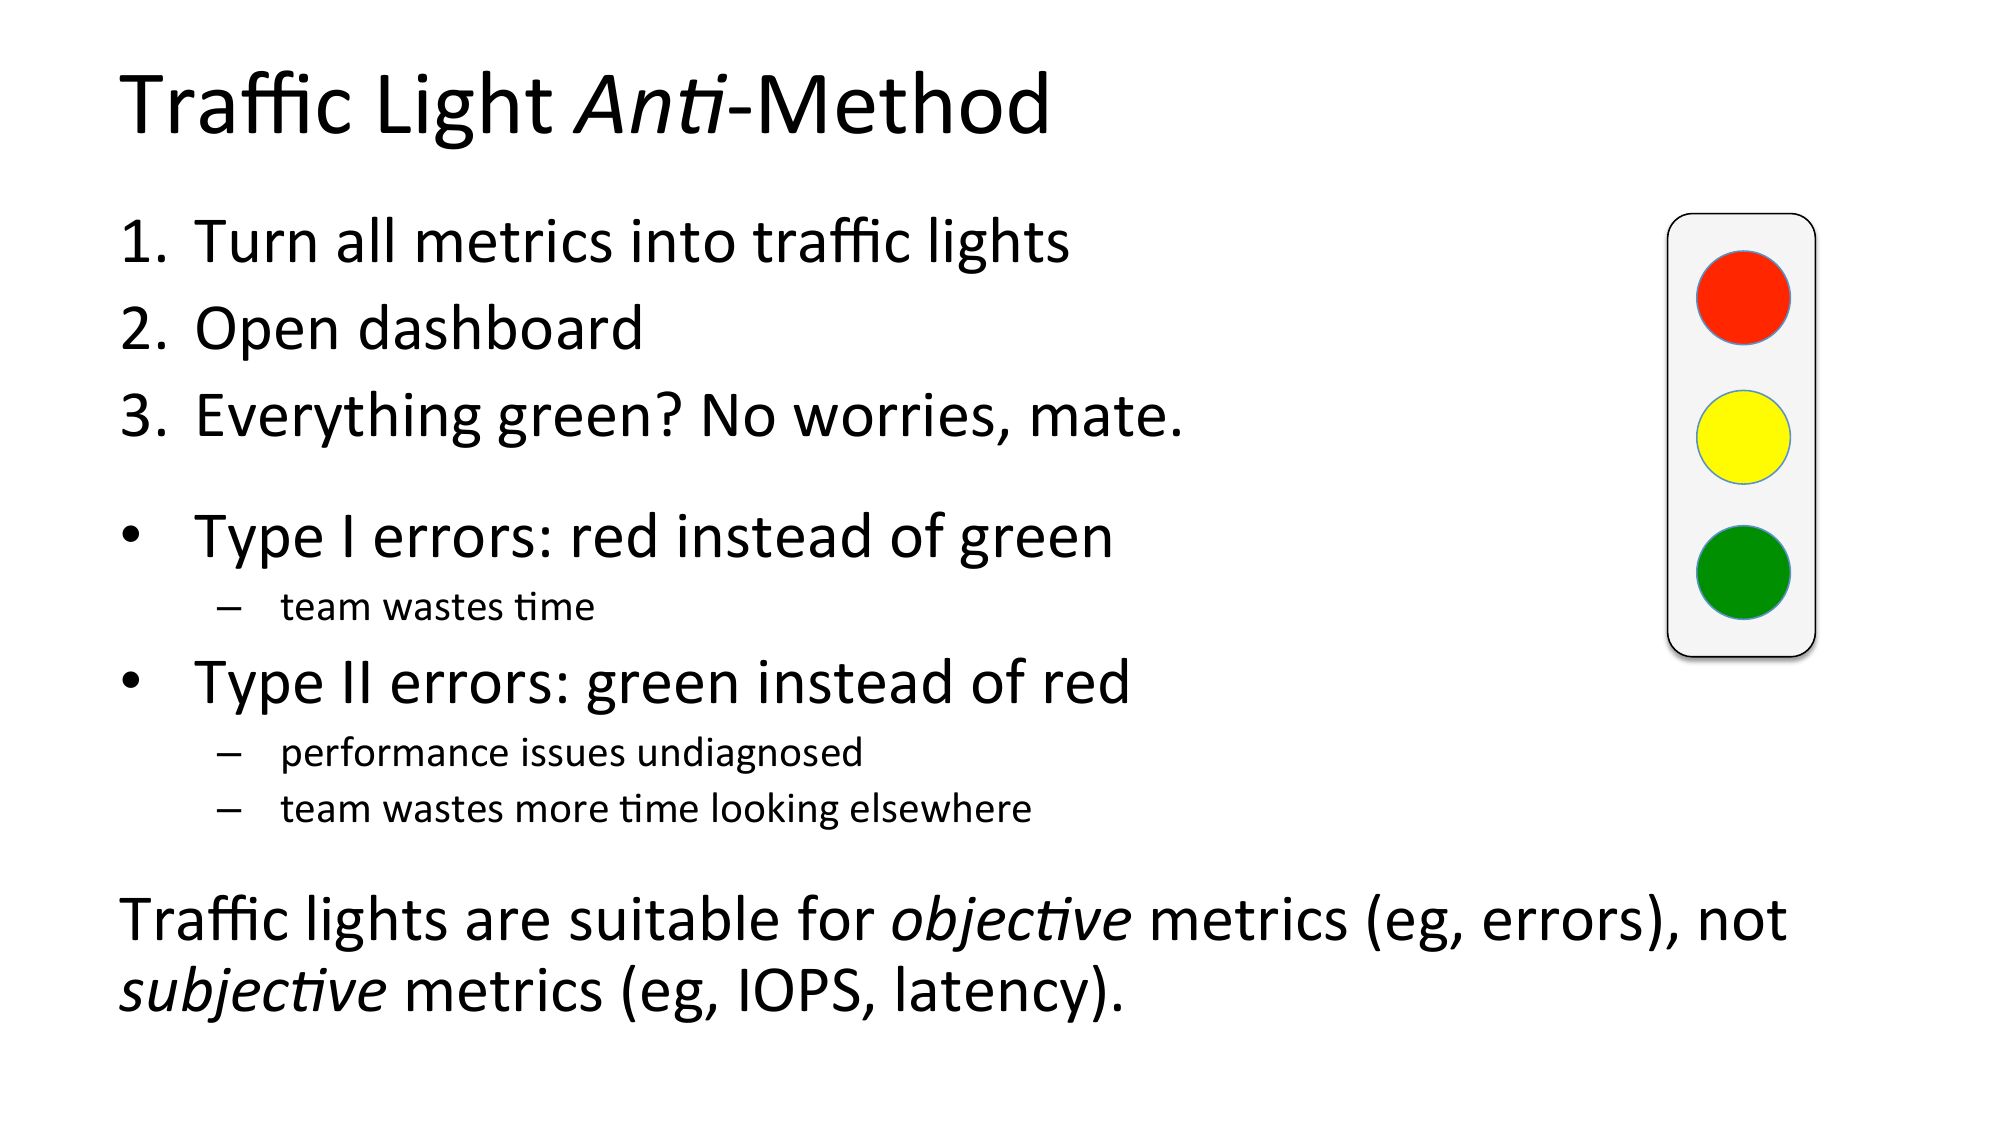
Traffic Light An2-Method
1. Turn all metrics into traffic lights
2. Open dashboard
3. Everything green? No worries, mate.
• Type I errors: red instead of green
– team wastes Nme
• Type II errors: green instead of red
– performance issues undiagnosed
– team wastes more Nme looking elsewhere
Traffic lights are suitable for objec2ve metrics (eg, errors), not
subjec2ve metrics (eg, IOPS, latency).
slide 14:
Methodologiesslide 15:
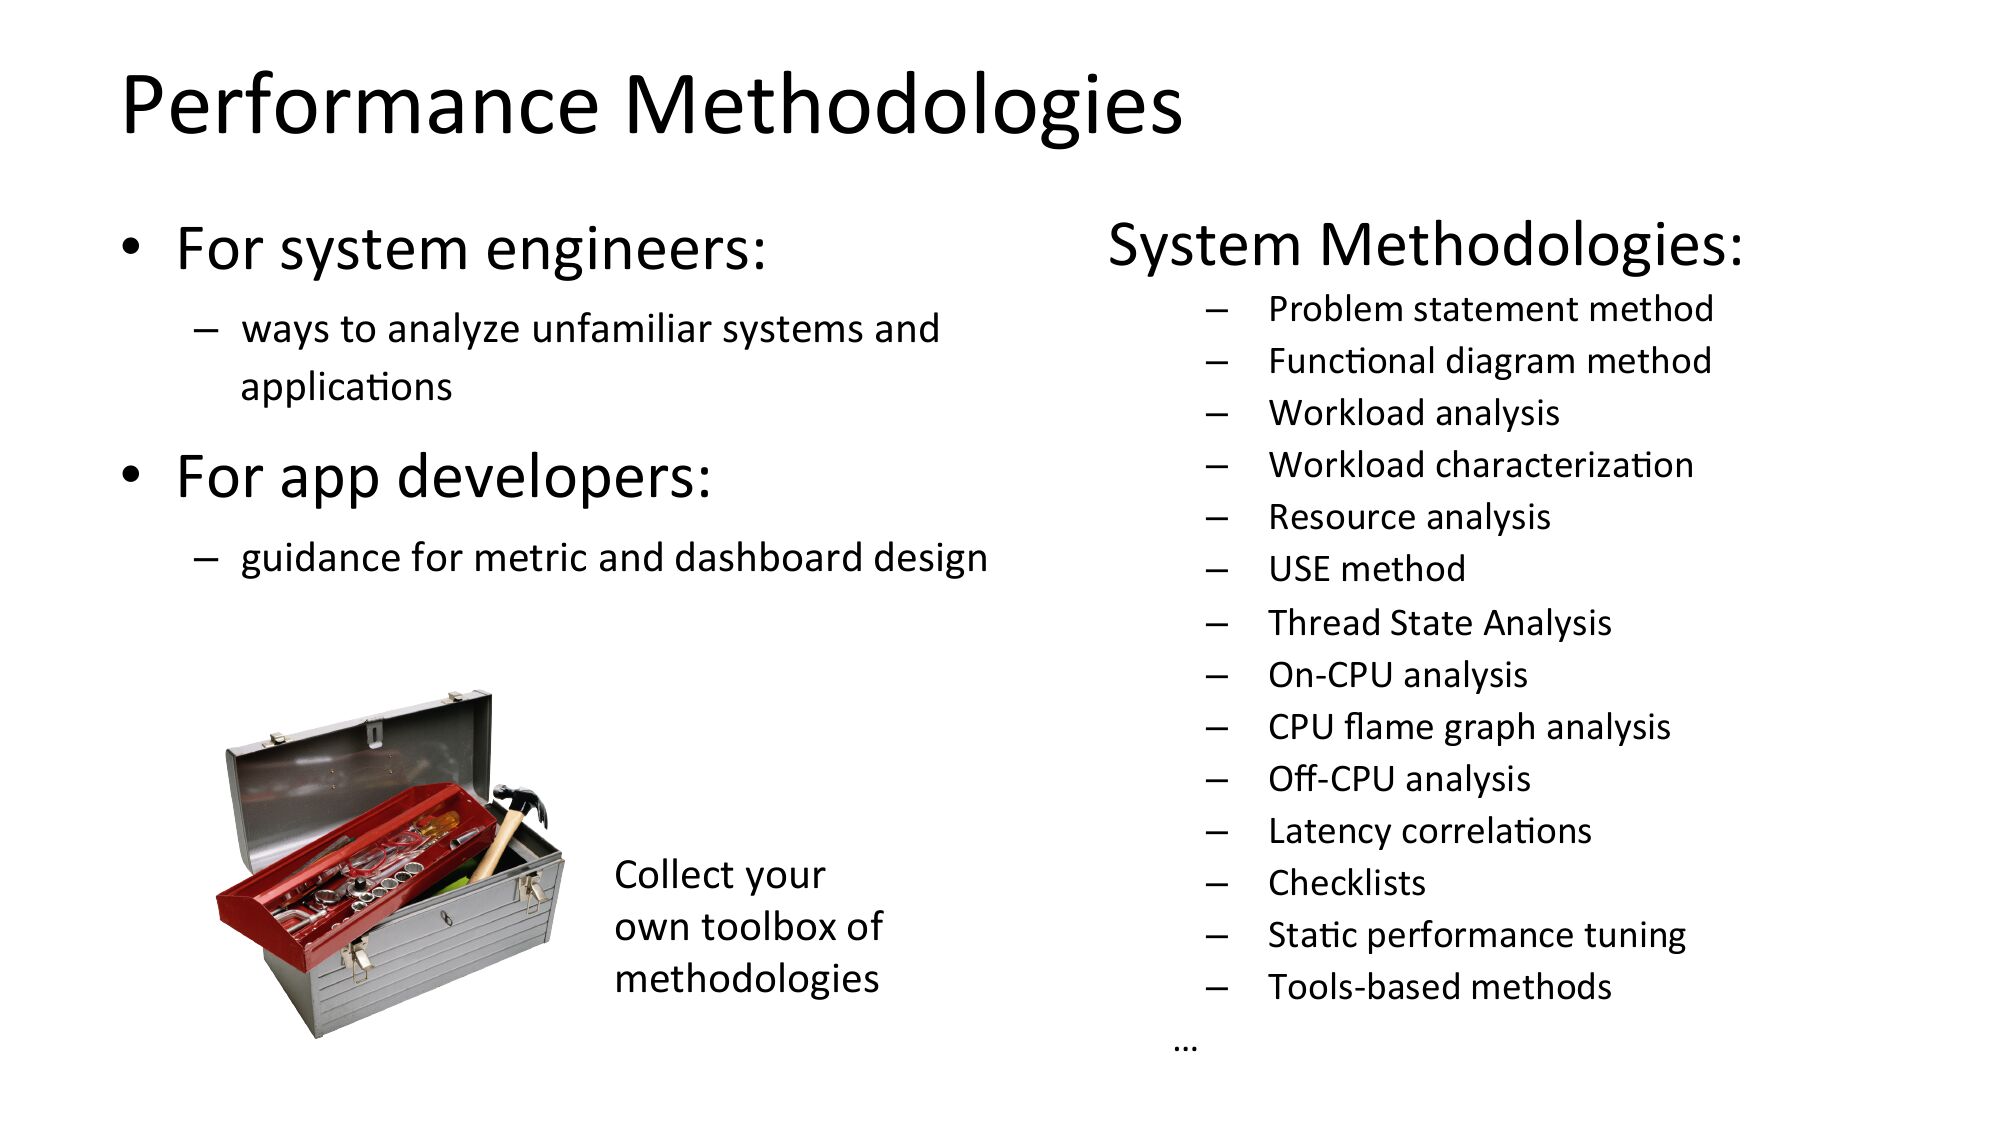
Performance Methodologies
• For system engineers:
System Methodologies:
– ways to analyze unfamiliar systems and
applicaNons
• For app developers:
– guidance for metric and dashboard design
Collect your
own toolbox of
methodologies
Problem statement method
FuncNonal diagram method
Workload analysis
Workload characterizaNon
Resource analysis
USE method
Thread State Analysis
On-CPU analysis
CPU flame graph analysis
Off-CPU analysis
Latency correlaNons
Checklists
StaNc performance tuning
Tools-based methods
slide 16:
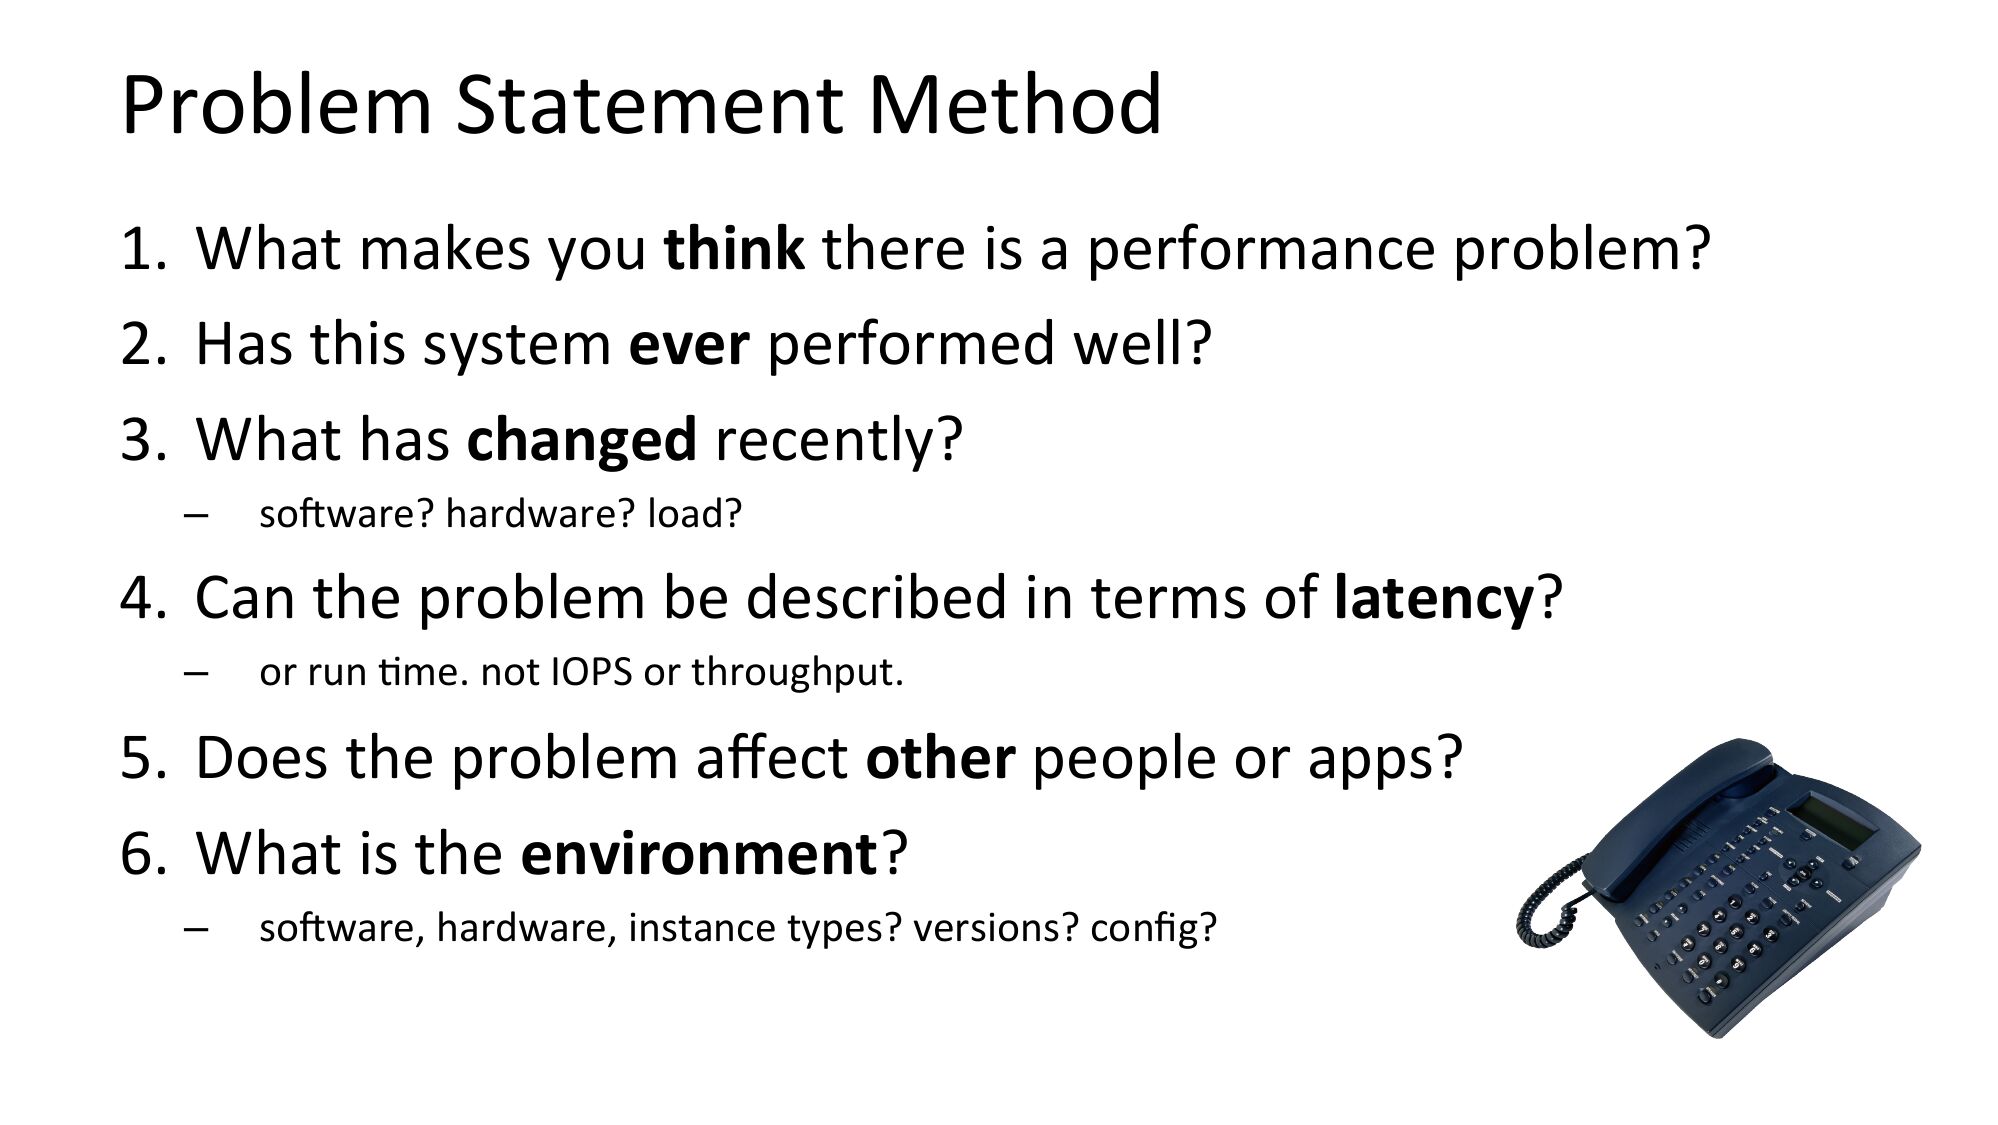
Problem Statement Method
1. What makes you think there is a performance problem?
2. Has this system ever performed well?
3. What has changed recently?
soRware? hardware? load?
4. Can the problem be described in terms of latency?
or run Nme. not IOPS or throughput.
5. Does the problem affect other people or apps?
6. What is the environment?
soRware, hardware, instance types? versions? config?
slide 17:
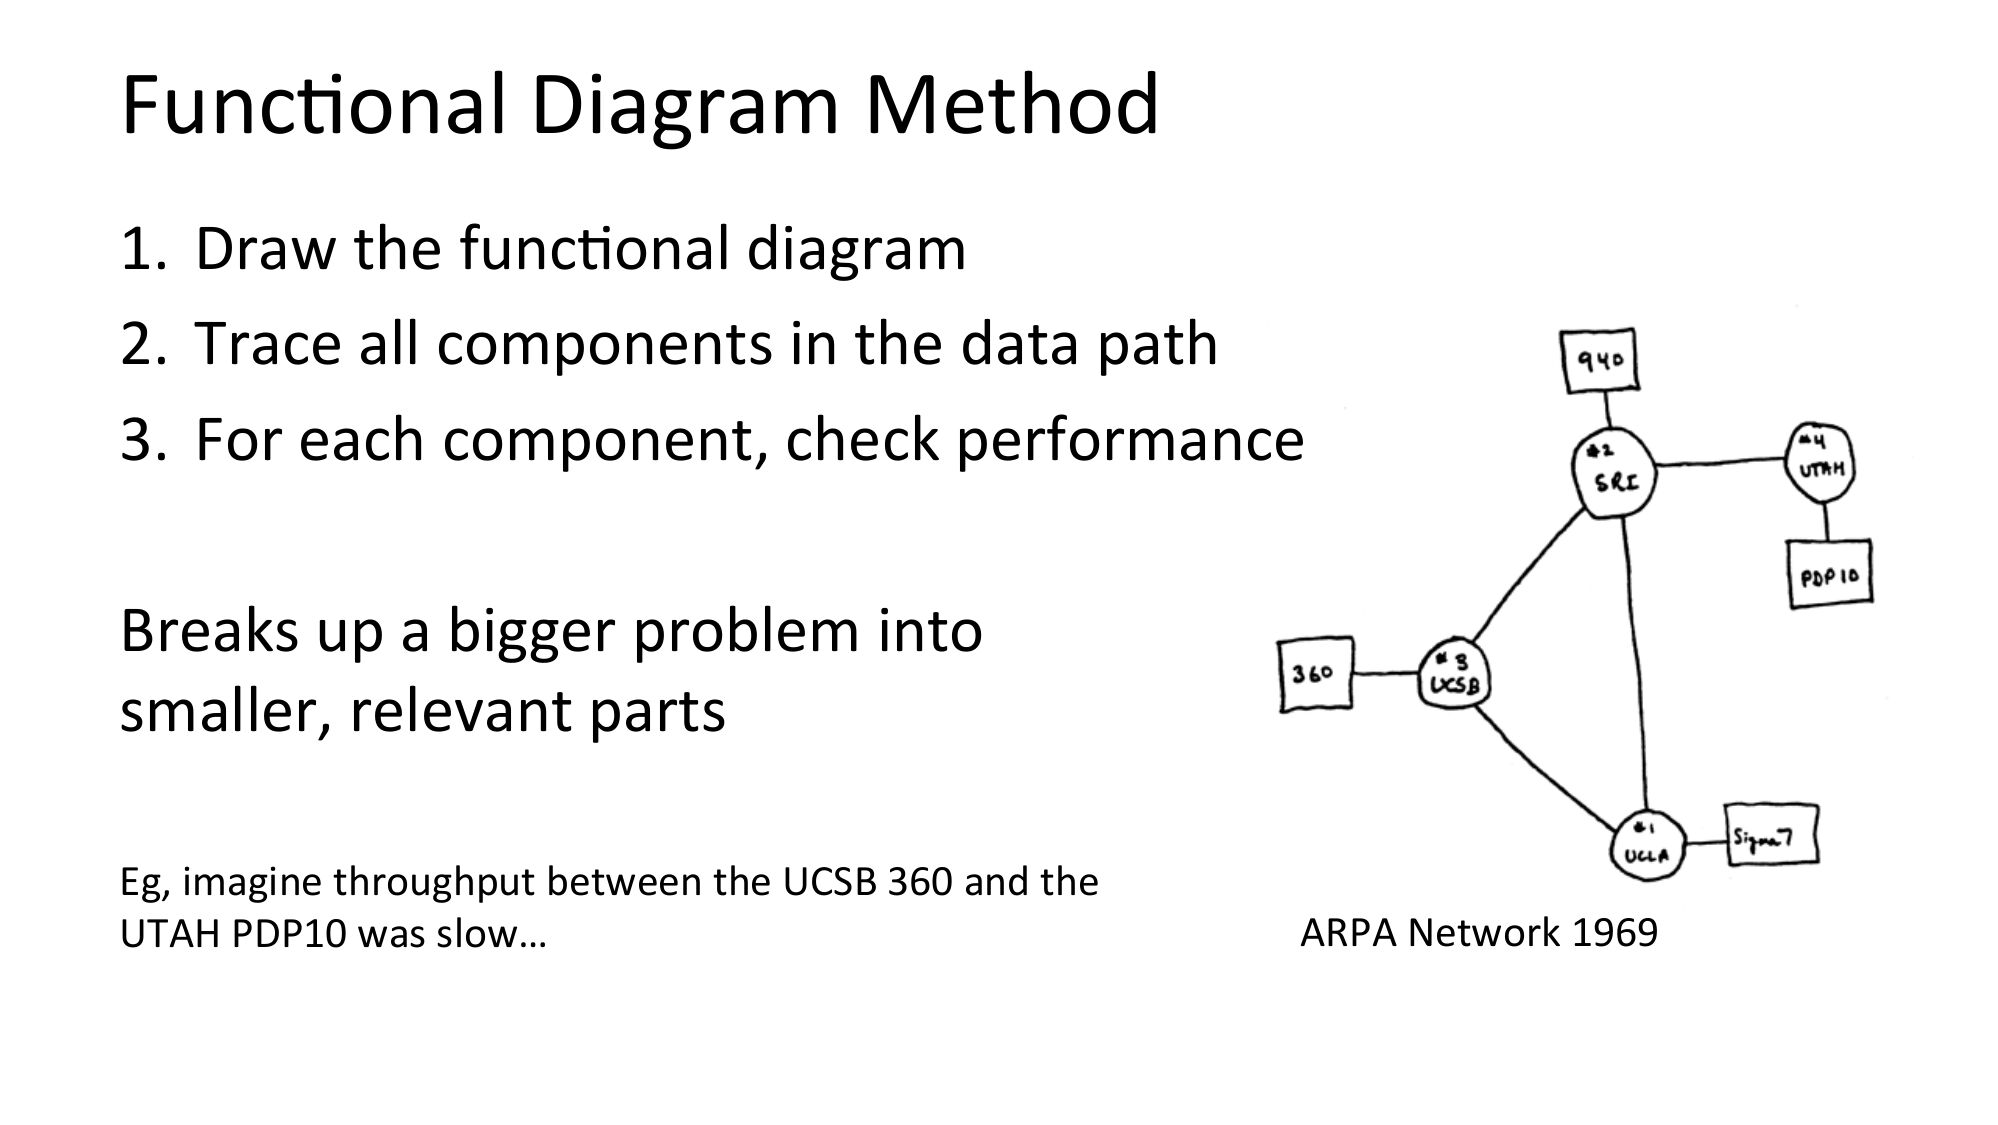
FuncNonal Diagram Method
1. Draw the funcNonal diagram
2. Trace all components in the data path
3. For each component, check performance
Breaks up a bigger problem into
smaller, relevant parts
Eg, imagine throughput between the UCSB 360 and the
UTAH PDP10 was slow…
ARPA Network 1969
slide 18:
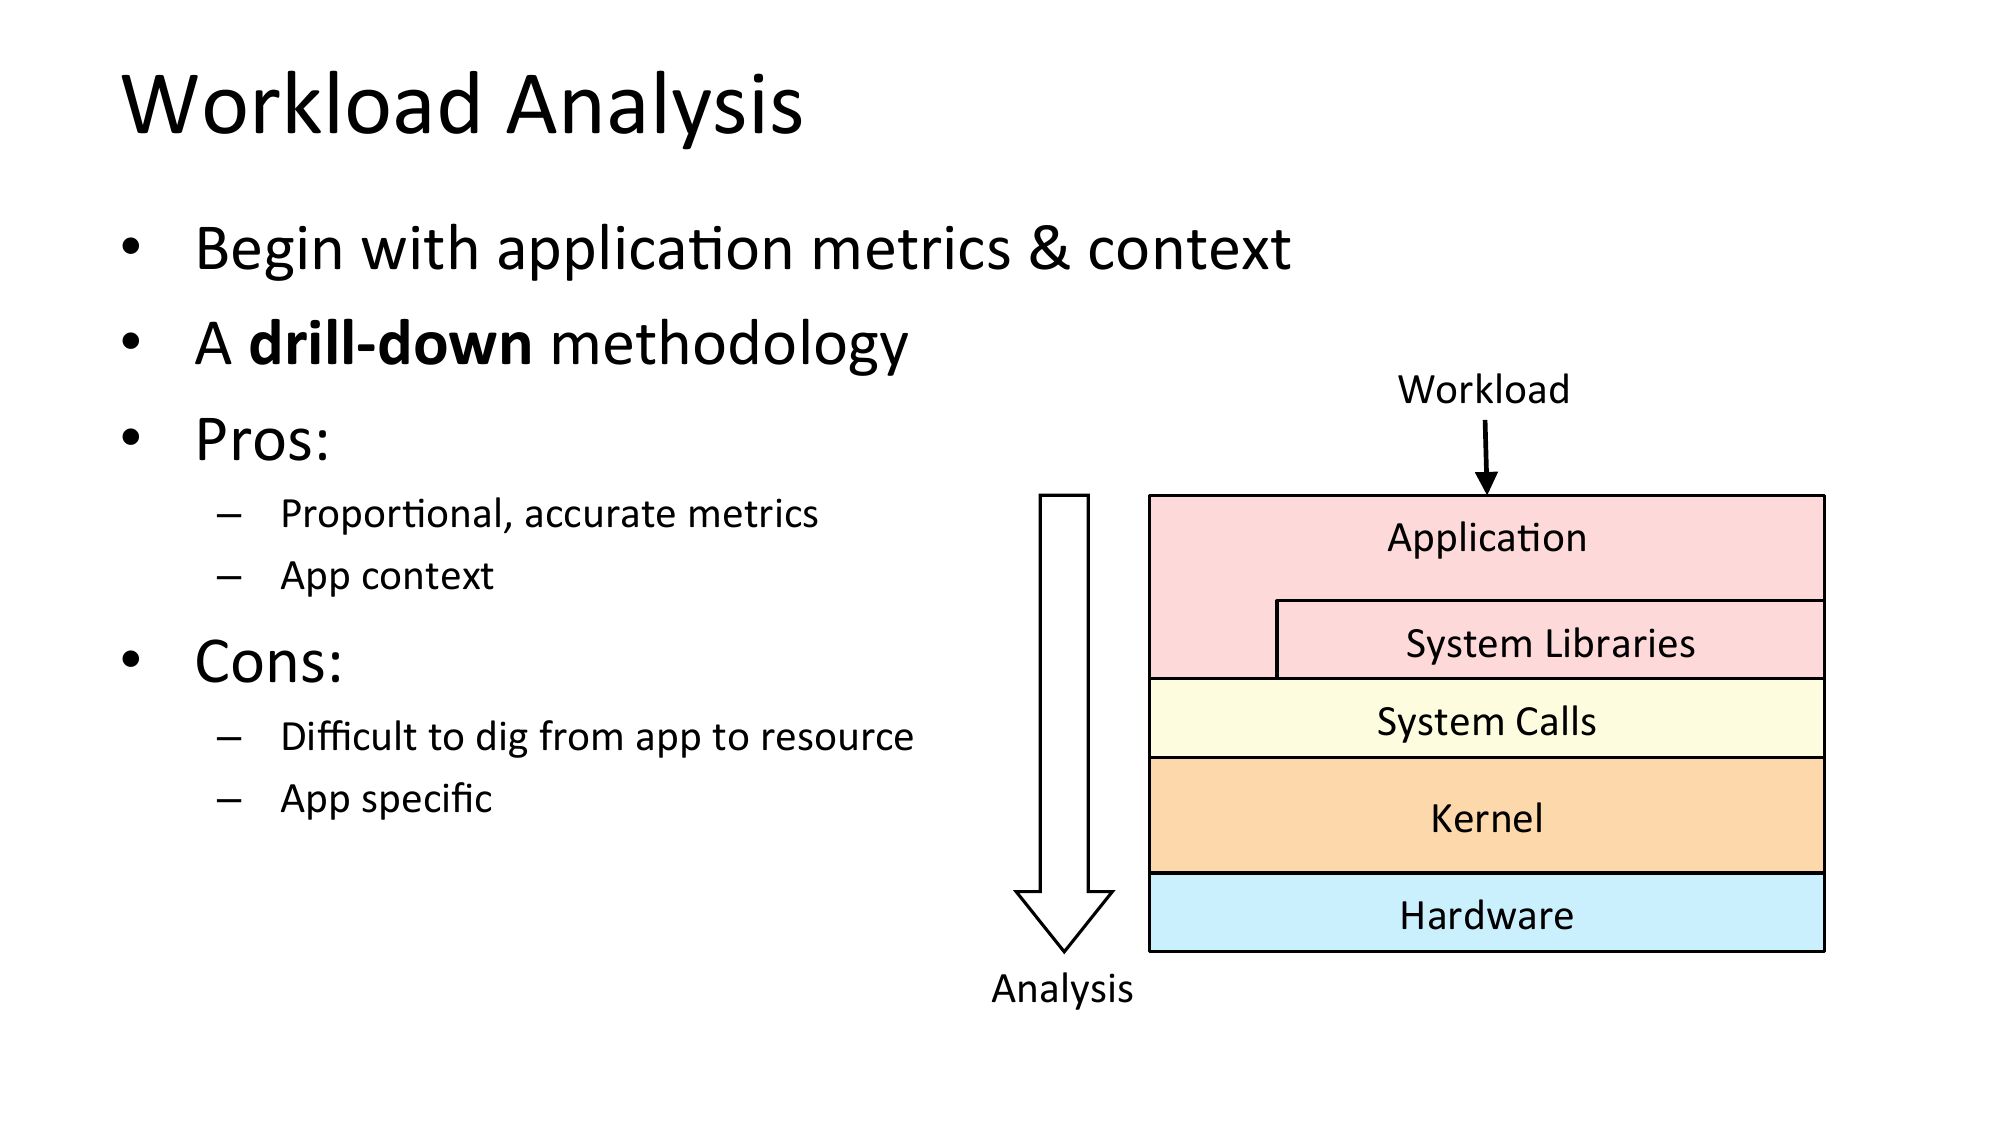
Workload Analysis
• Begin with applicaNon metrics & context
• A drill-down methodology
• Pros:
– ProporNonal, accurate metrics
– App context
Workload
ApplicaNon
System Libraries
• Cons:
System Calls
– Difficult to dig from app to resource
– App specific
Kernel
Hardware
Analysis
slide 19:
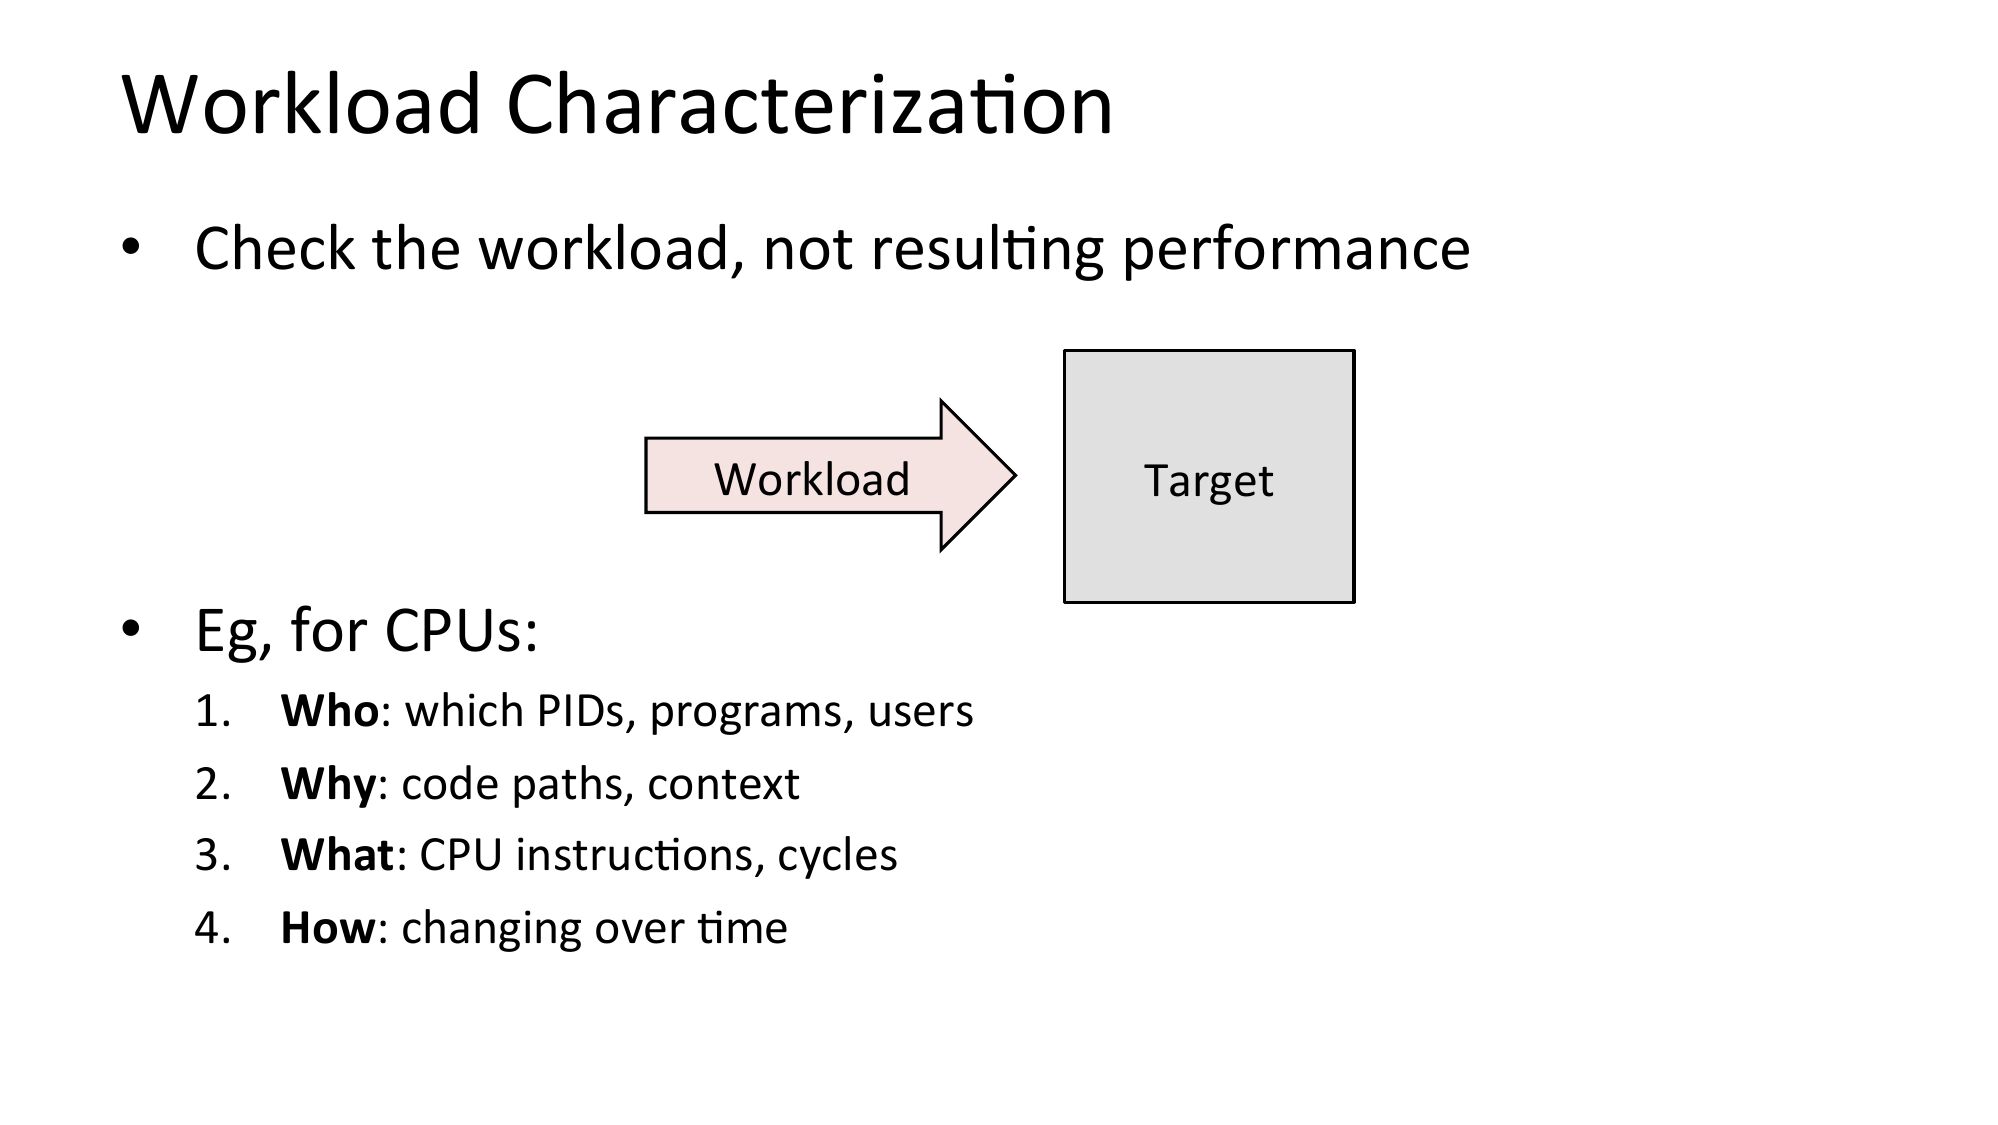
Workload CharacterizaNon
• Check the workload, not resulNng performance
Workload
• Eg, for CPUs:
Who: which PIDs, programs, users
Why: code paths, context
What: CPU instrucNons, cycles
How: changing over Nme
Target
slide 20:
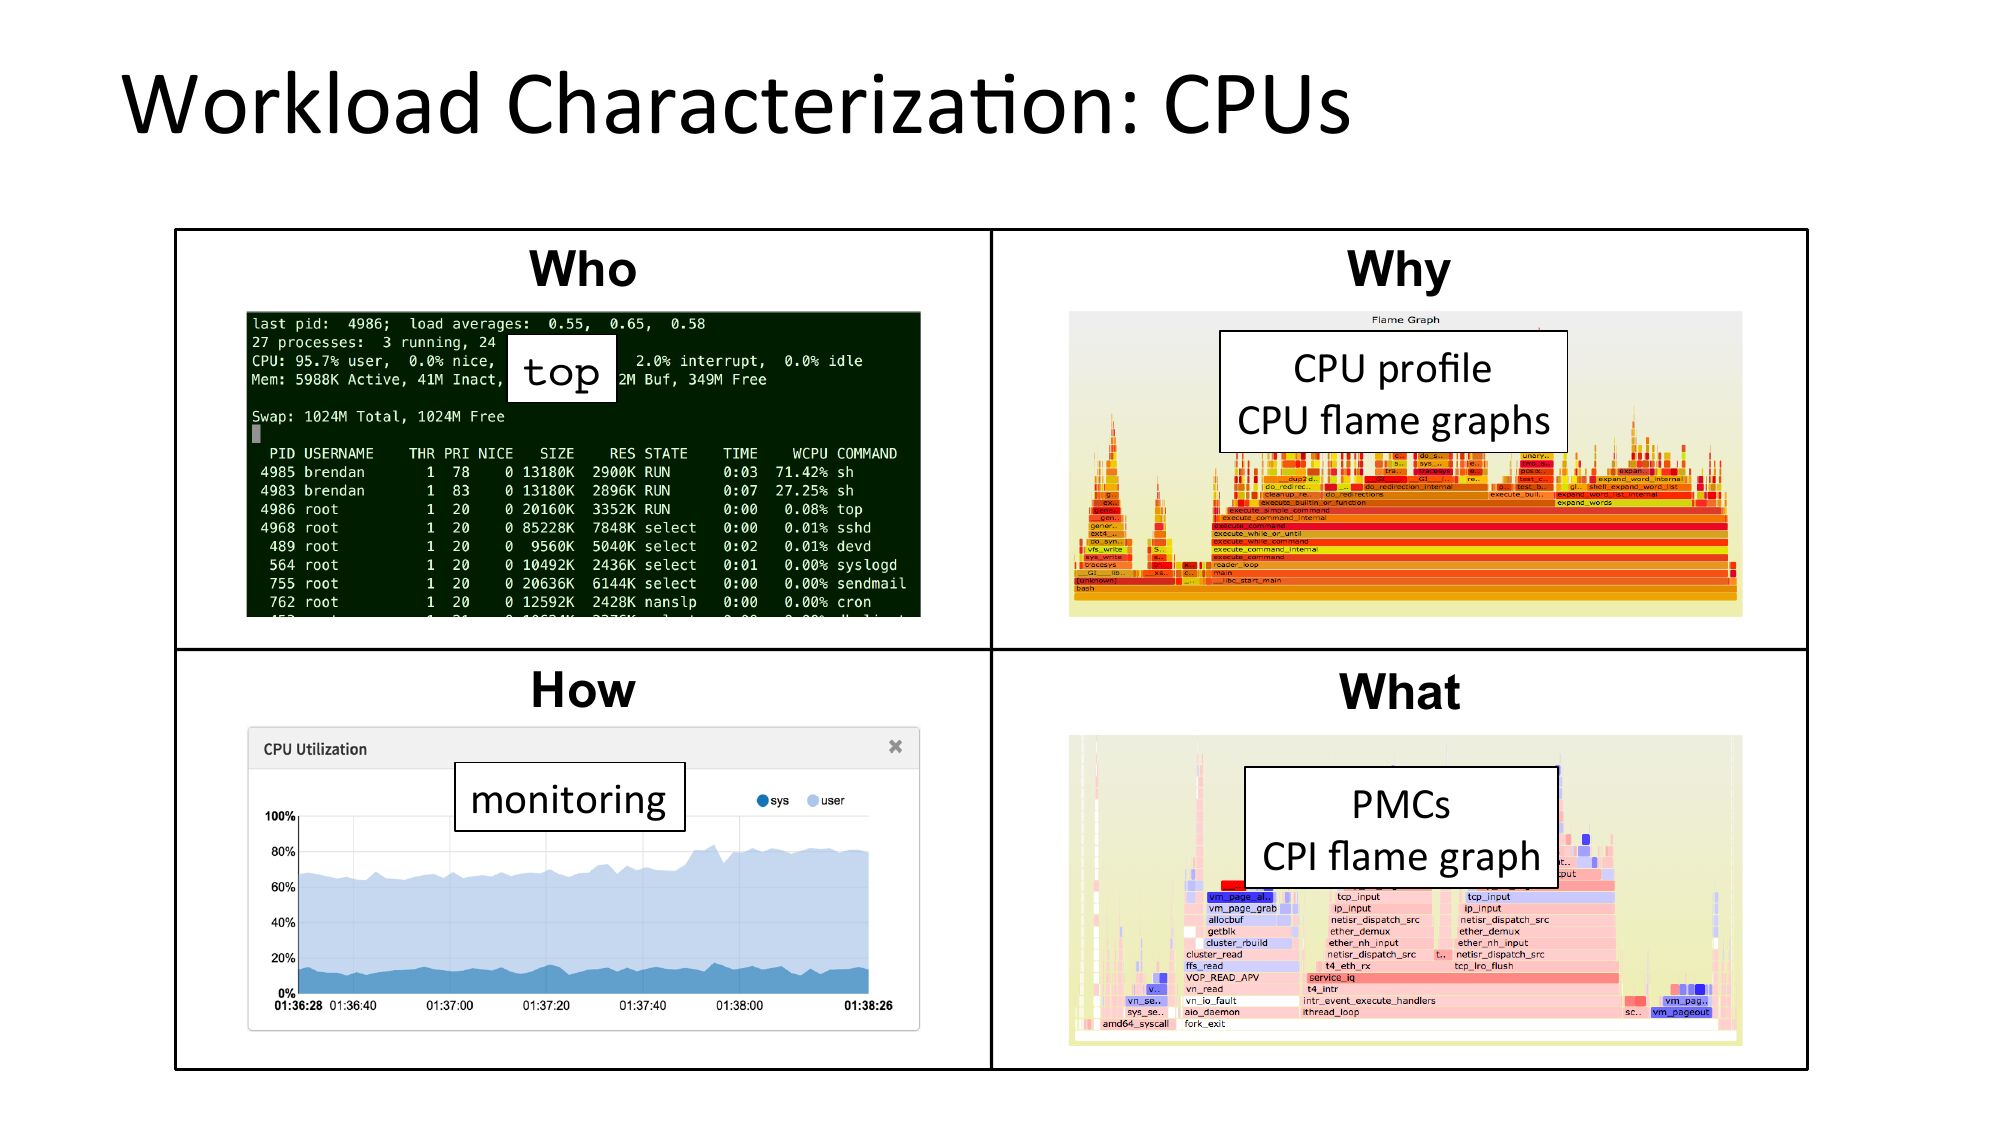
Workload CharacterizaNon: CPUs
Who
Why
top
CPU profile
CPU flame graphs
How
What
monitoring
PMCs
CPI flame graph
slide 21:
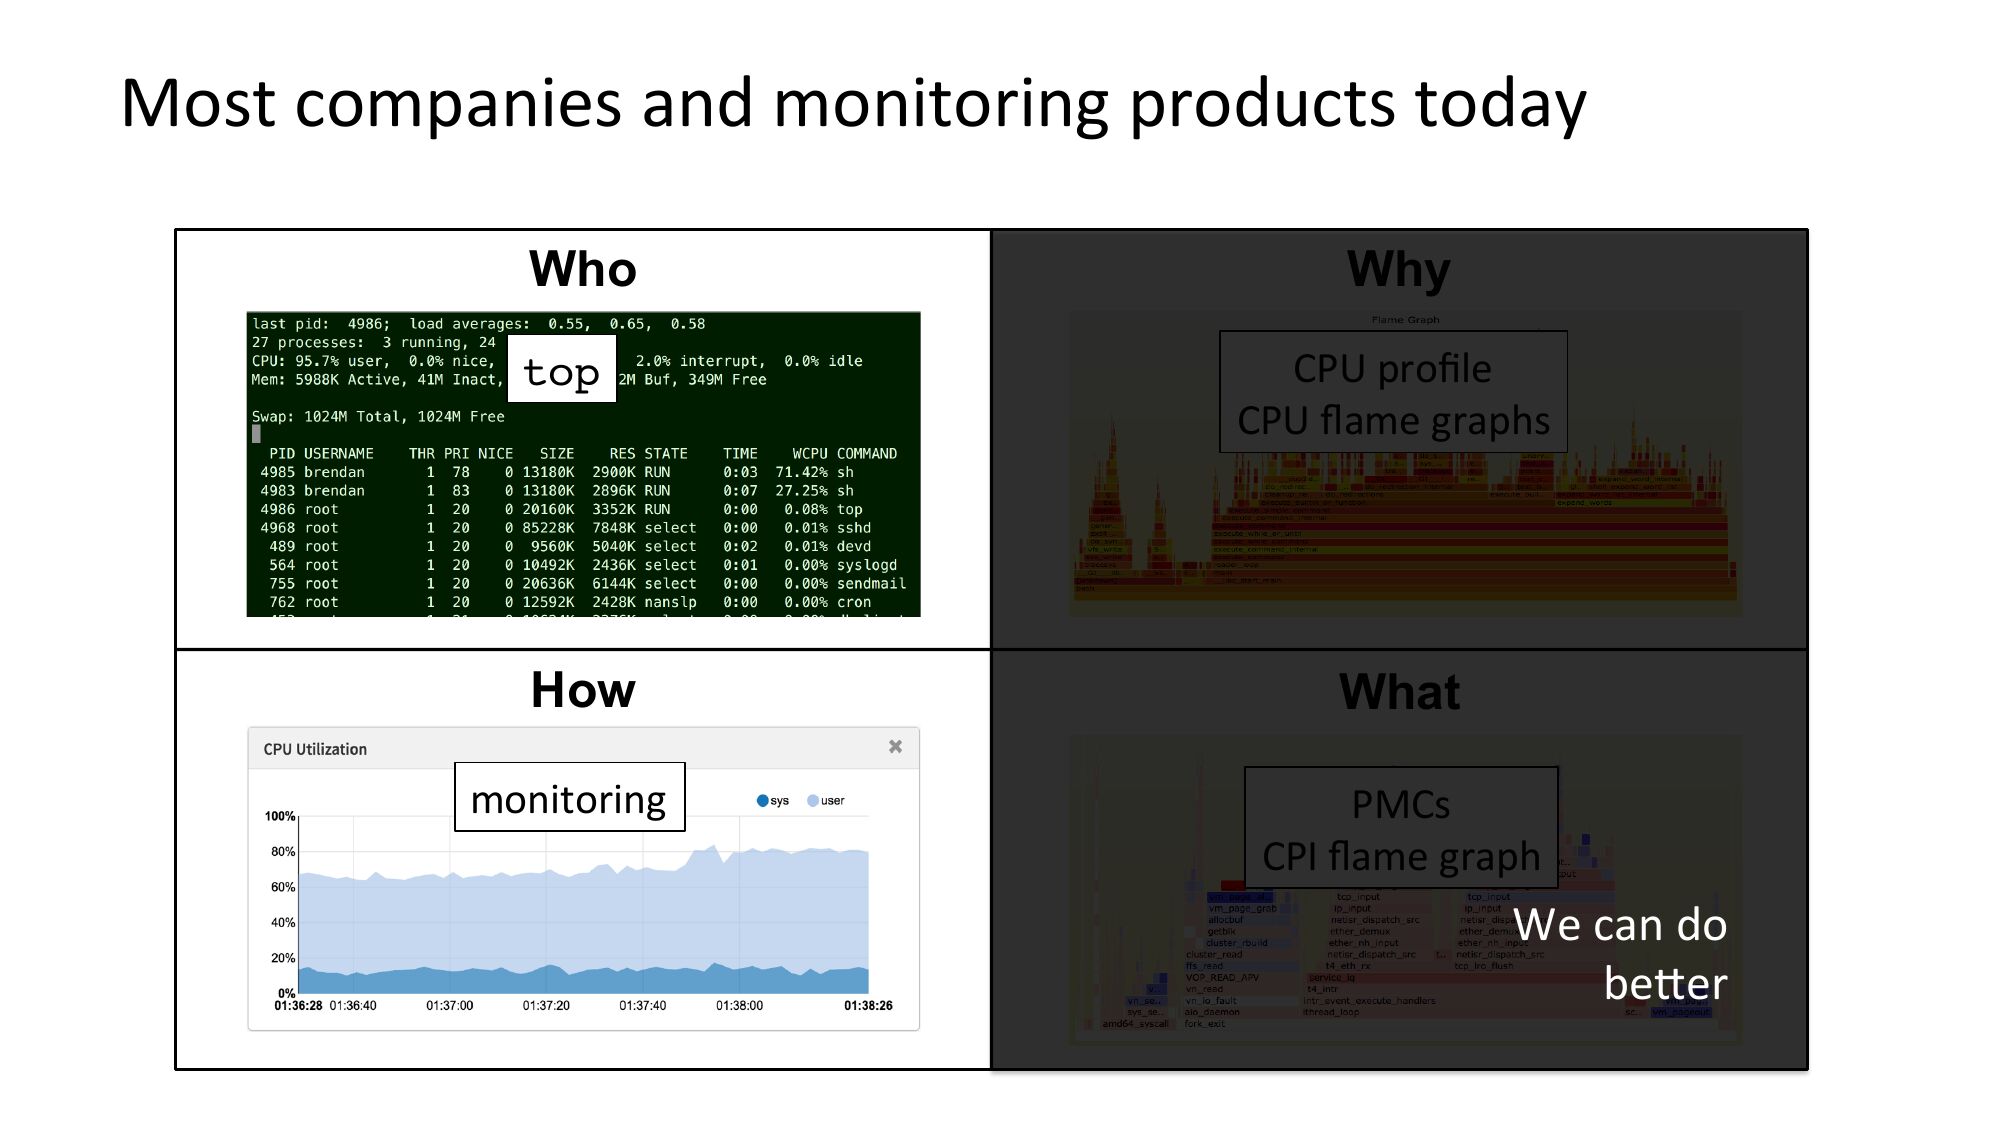
Most companies and monitoring products today
Who
Why
top
CPU profile
CPU flame graphs
How
What
monitoring
PMCs
CPI flame graph
We can do
bejer
slide 22:
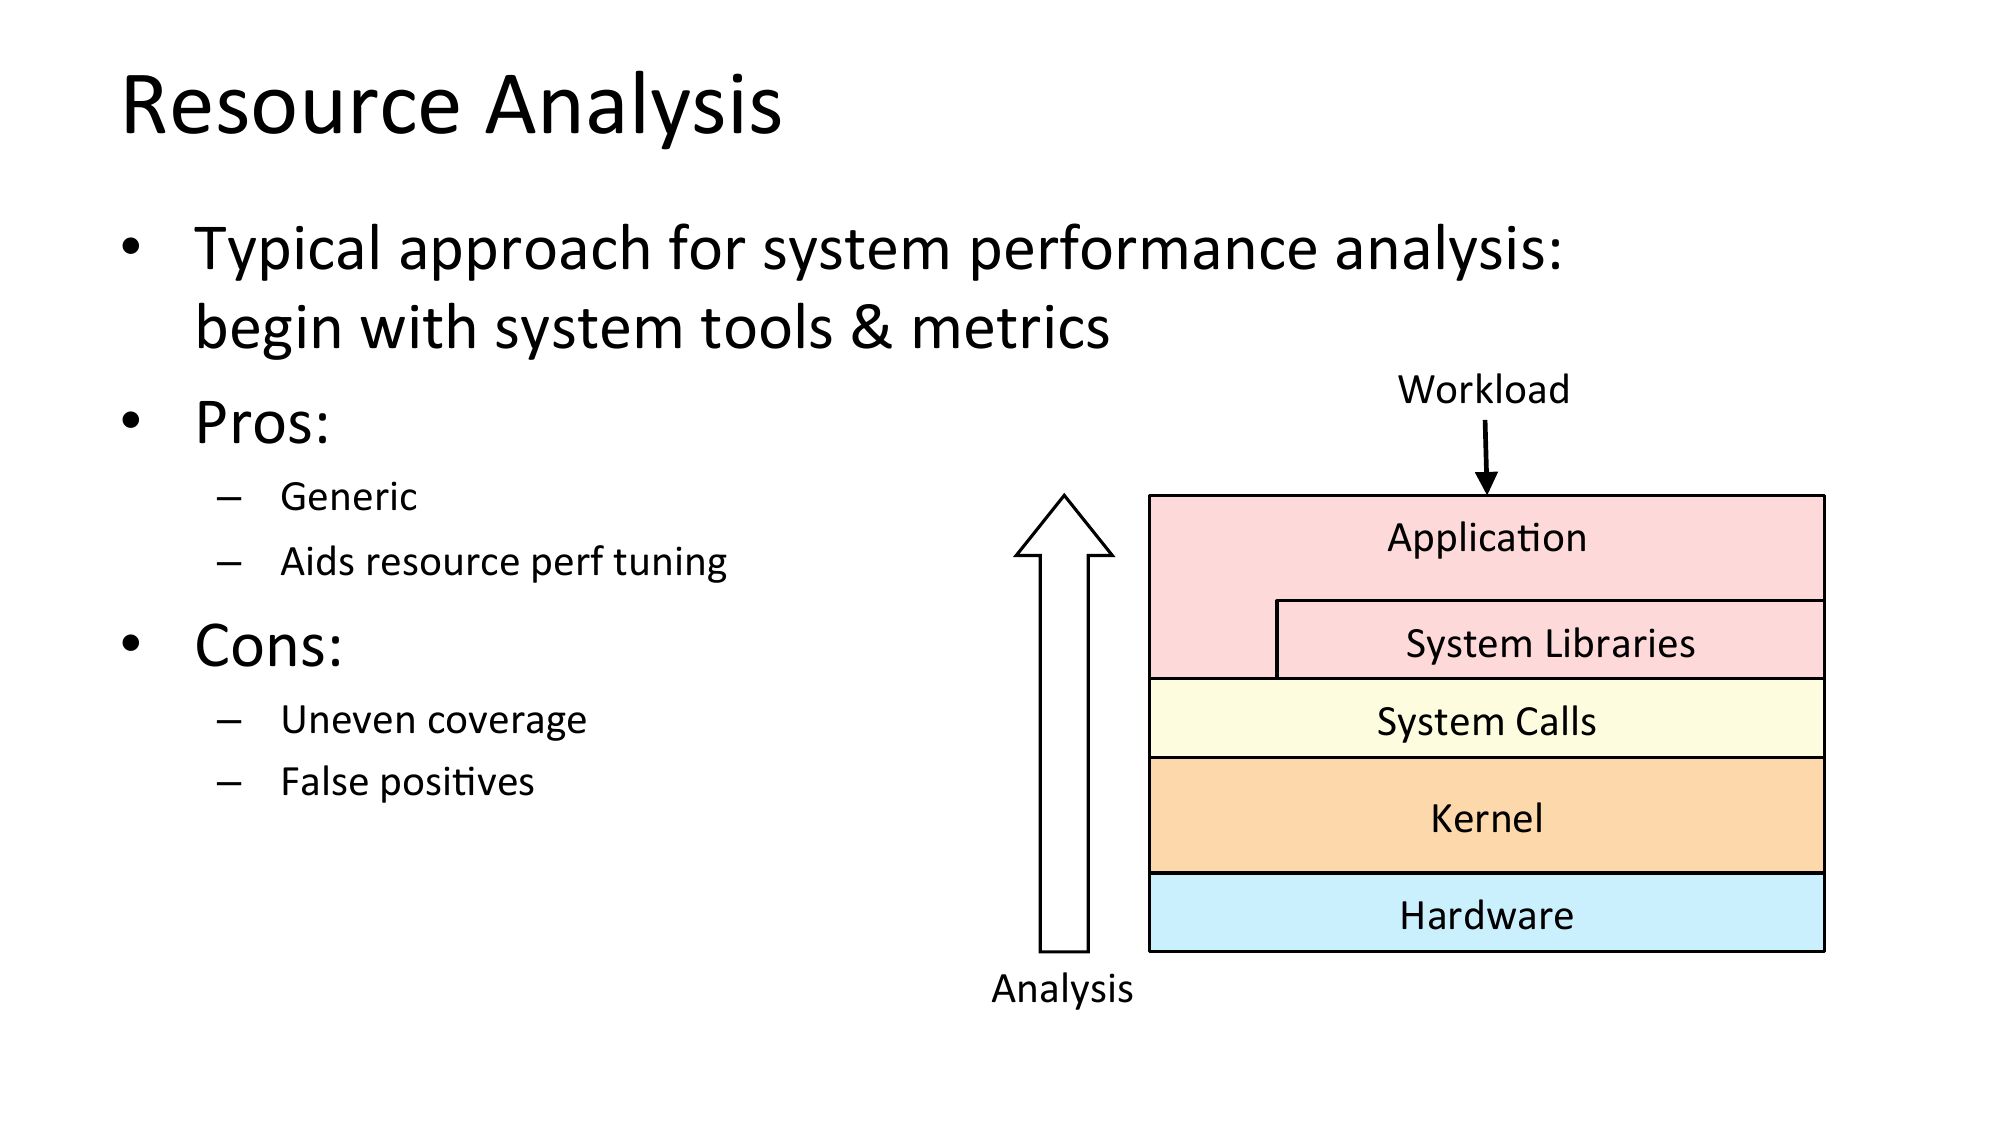
Resource Analysis
• Typical approach for system performance analysis:
begin with system tools & metrics
Workload
• Pros:
– Generic
– Aids resource perf tuning
ApplicaNon
• Cons:
System Libraries
– Uneven coverage
– False posiNves
System Calls
Kernel
Hardware
Analysis
slide 23:
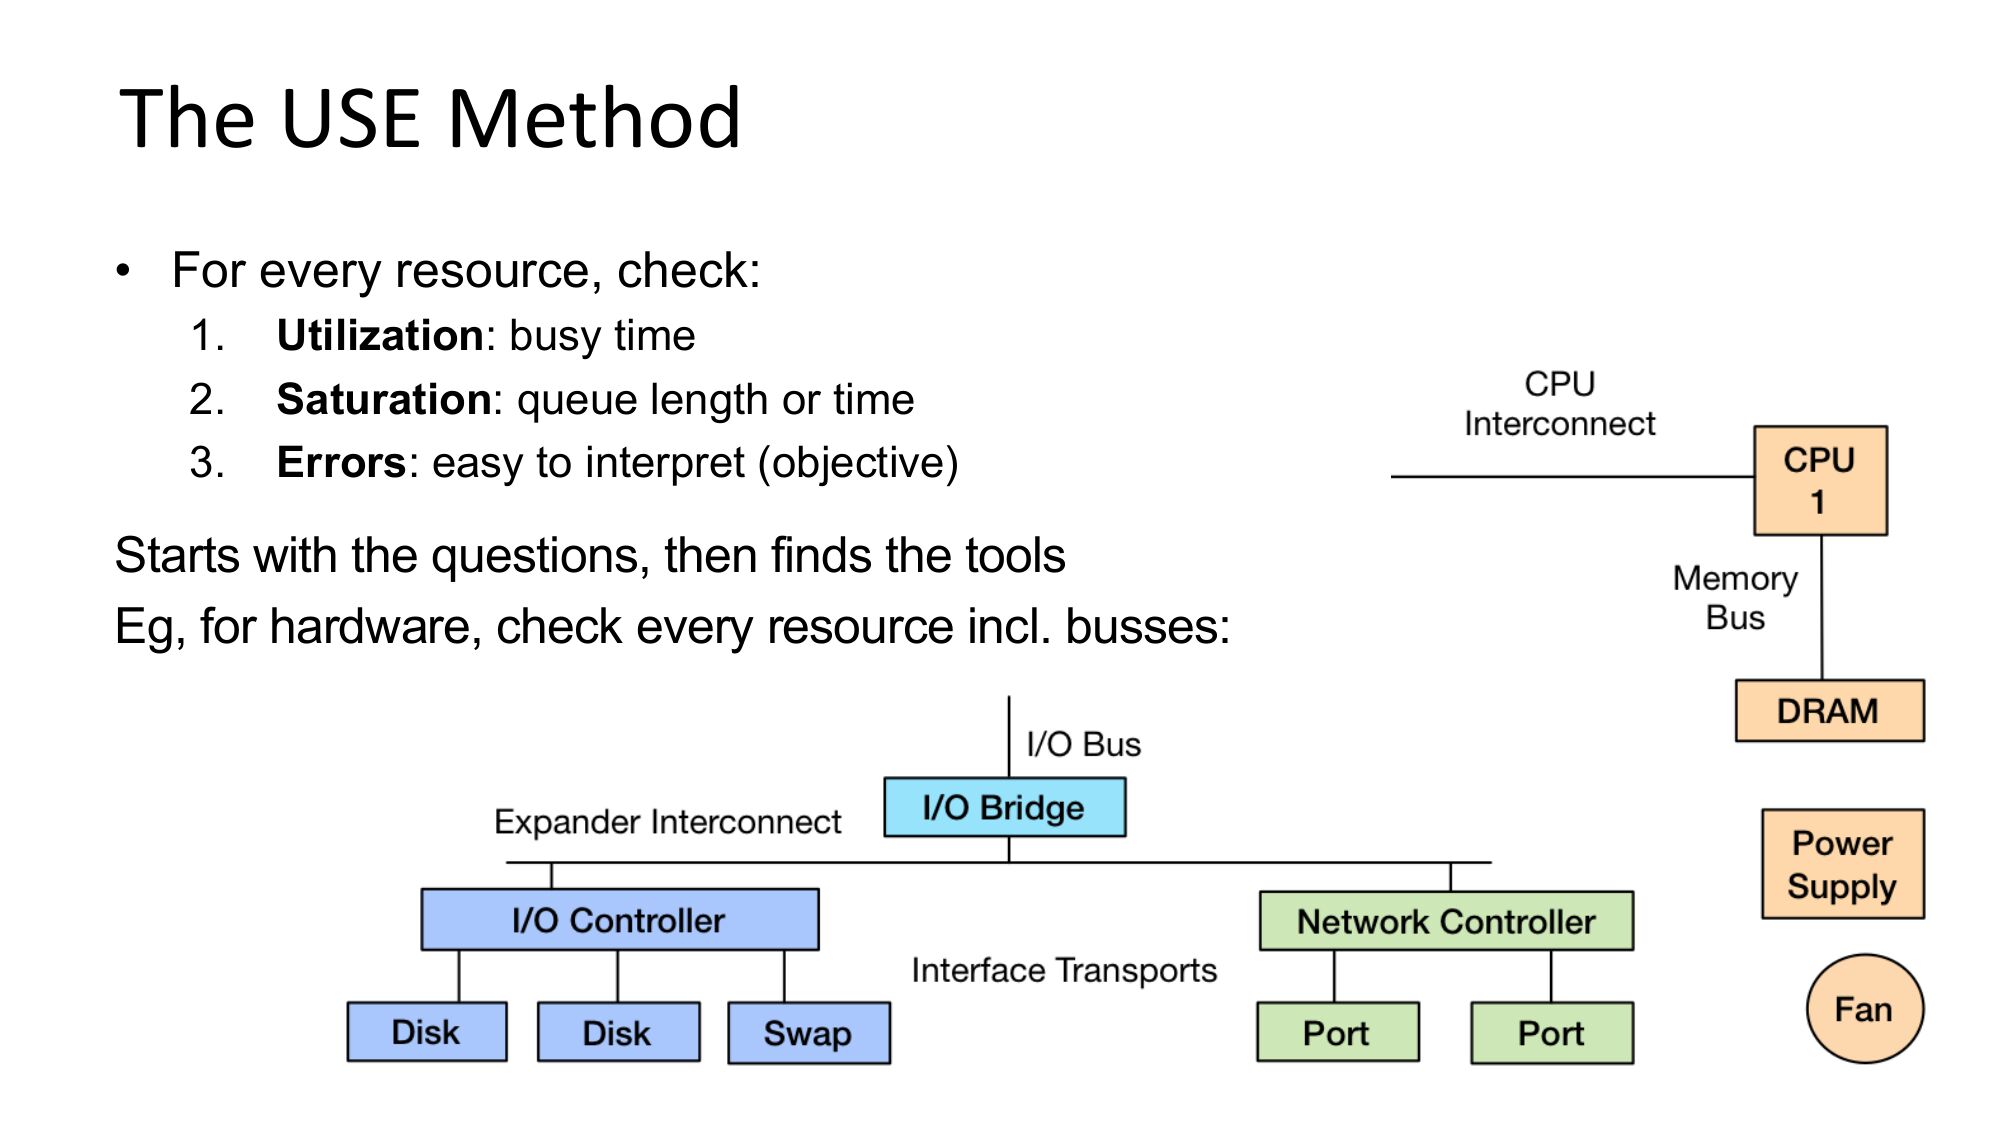
The USE Method
• For every resource, check:
Utilization: busy time
Saturation: queue length or time
Errors: easy to interpret (objective)
Starts with the questions, then finds the tools
Eg, for hardware, check every resource incl. busses:
slide 24:
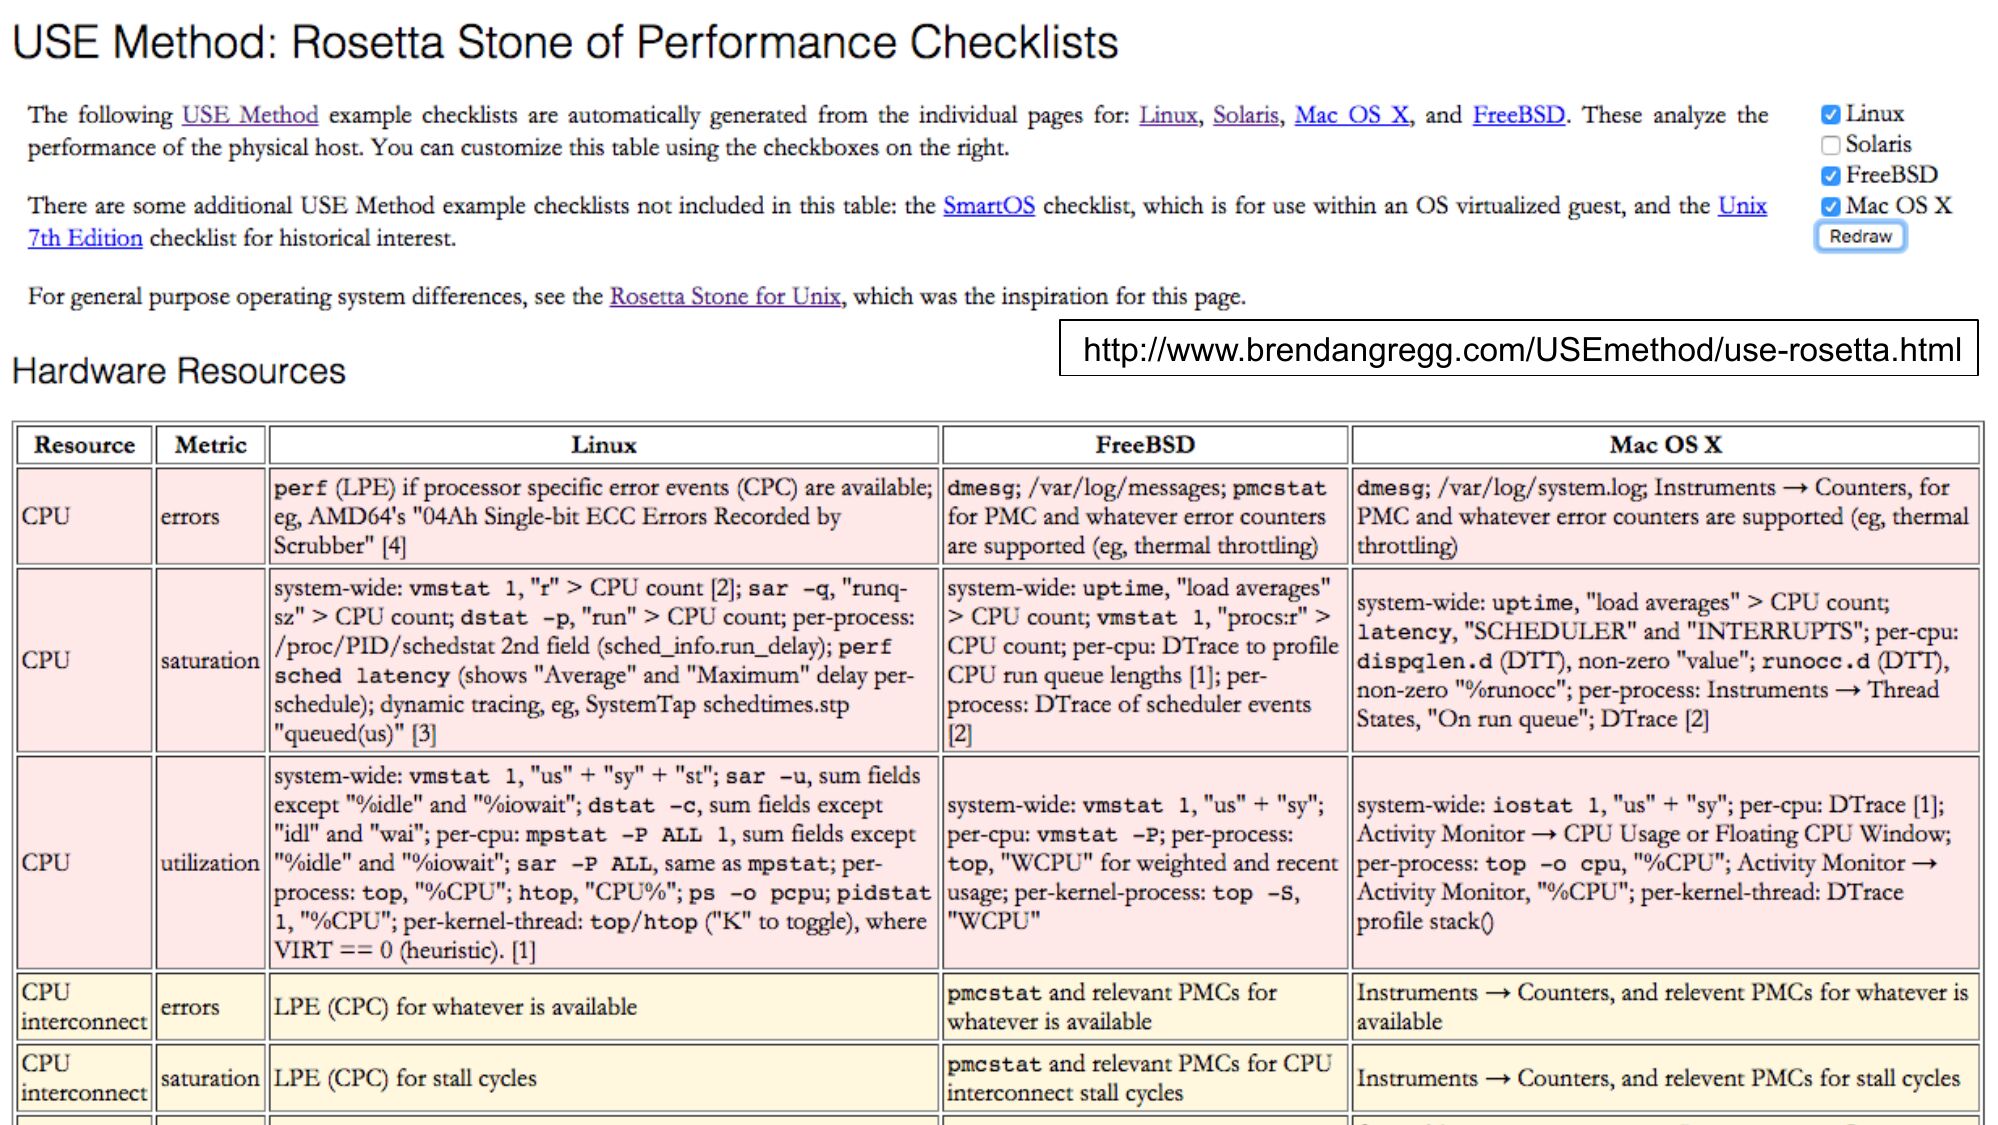
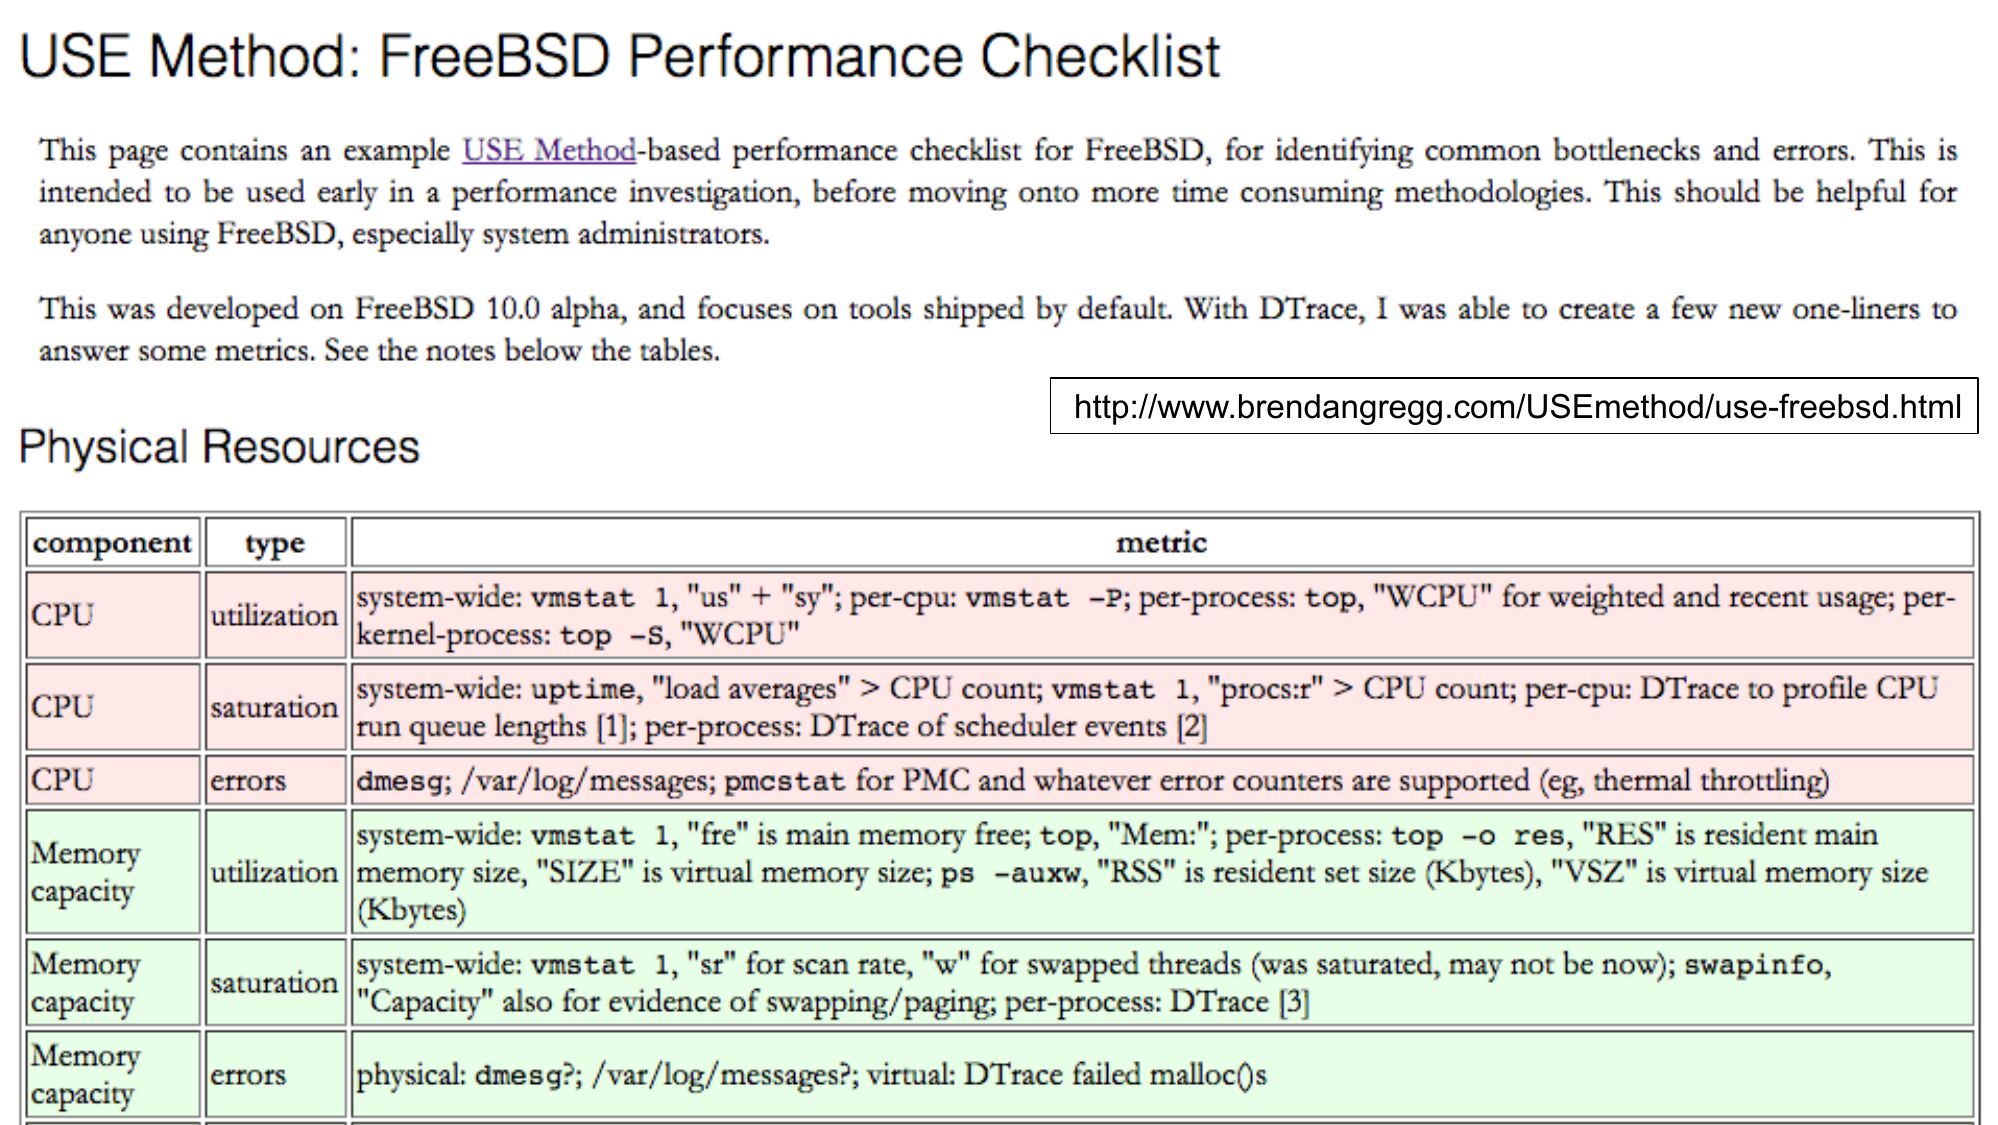
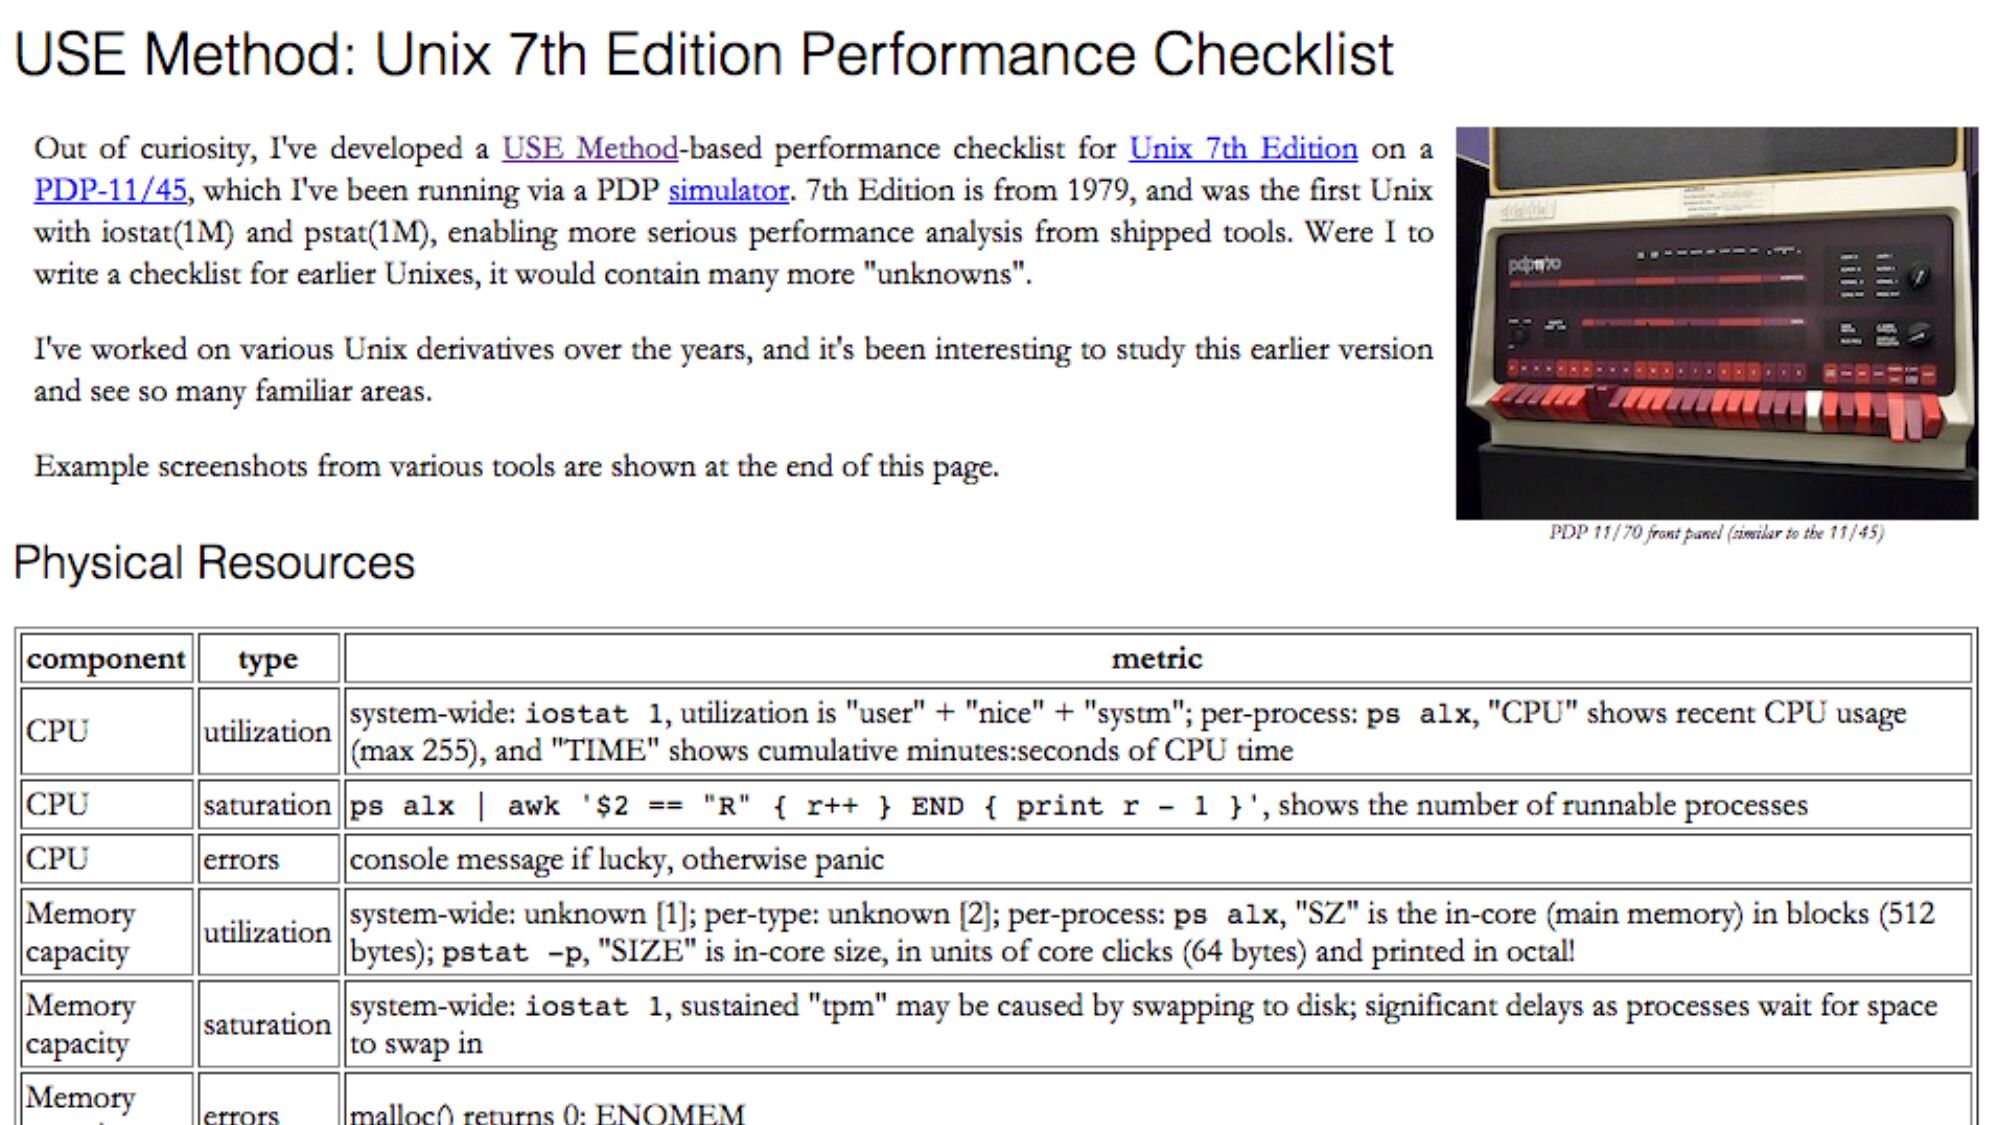
http://www.brendangregg.com/USEmethod/use-rosetta.htmlslide 25:
http://www.brendangregg.com/USEmethod/use-freebsd.htmlslide 26:
slide 27:
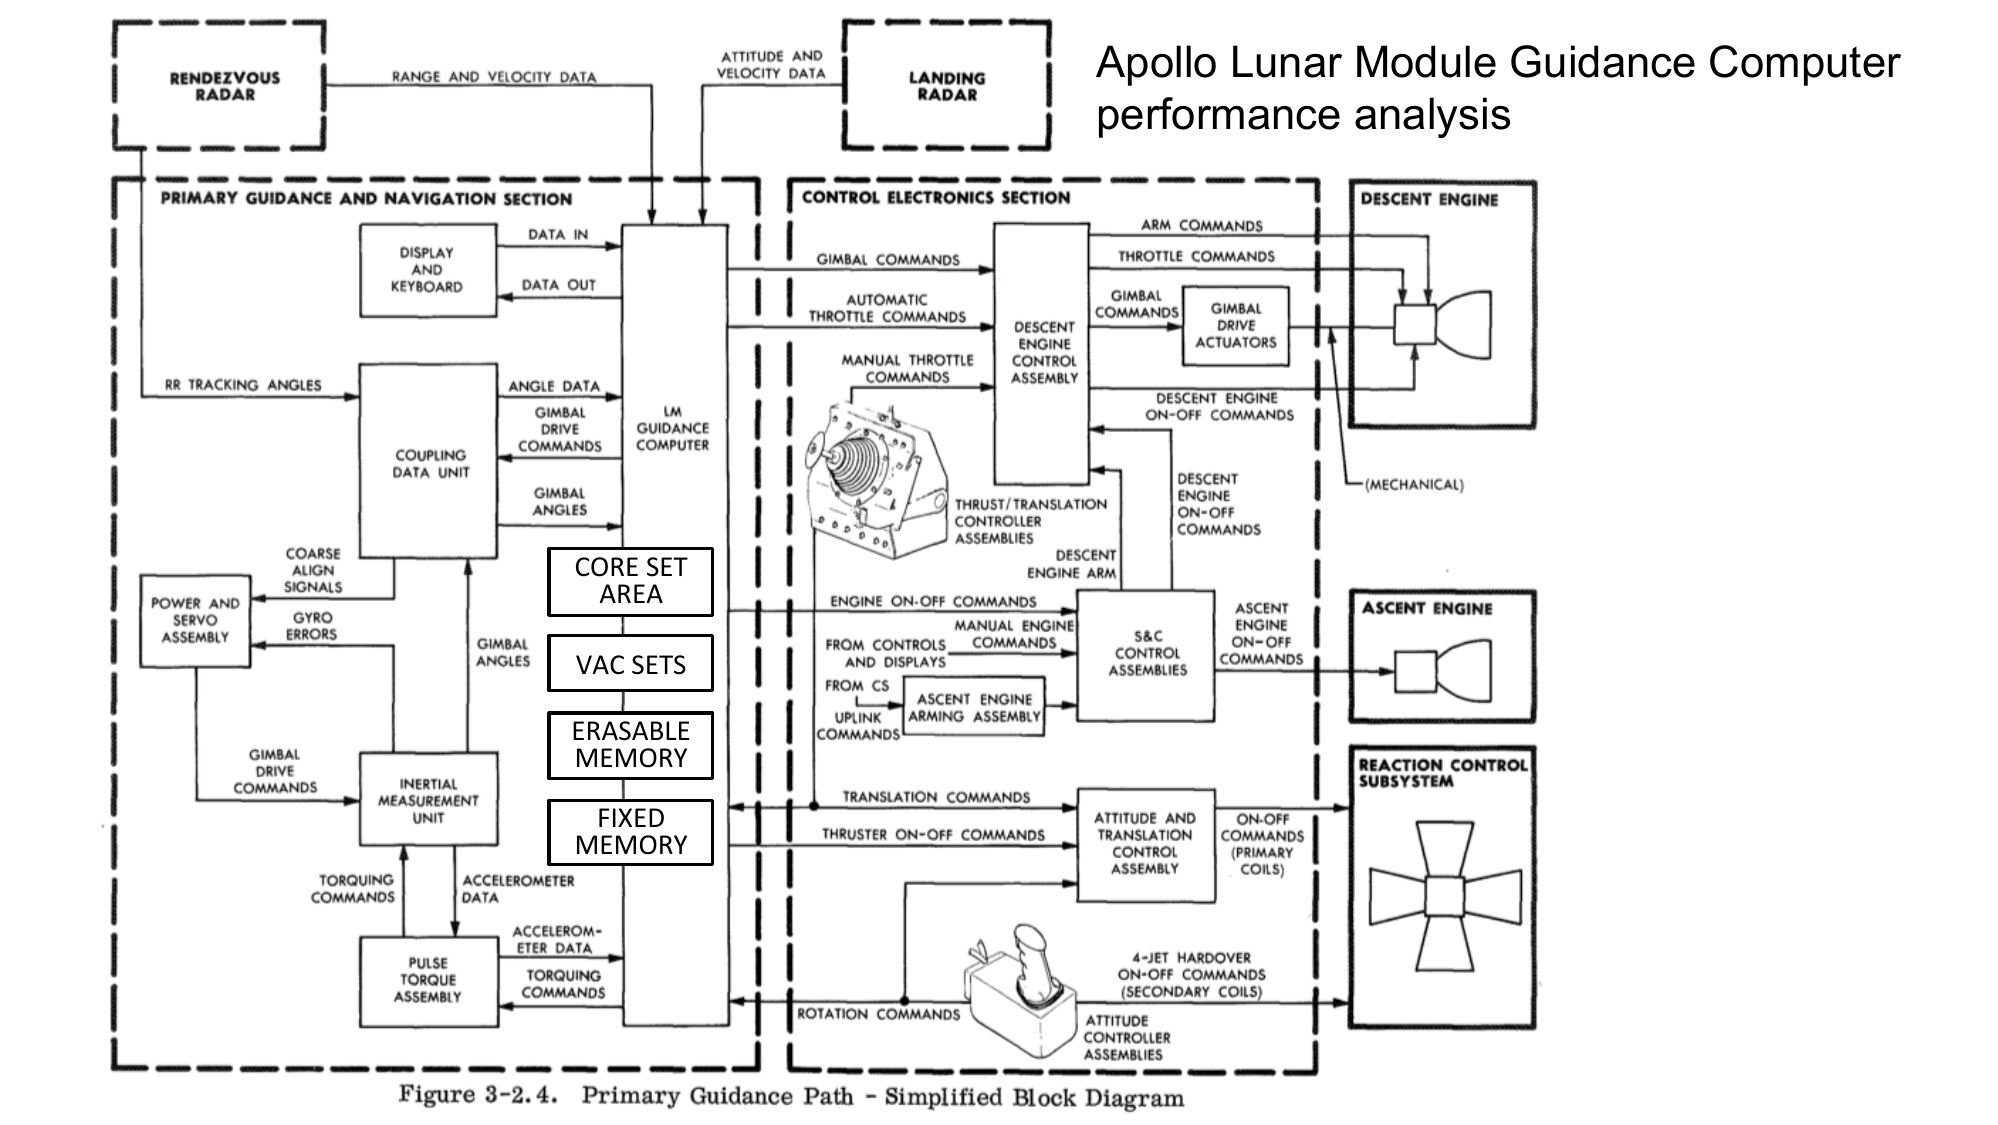
Apollo Lunar Module Guidance Computer
performance analysis
CORE SET
AREA
VAC SETS
ERASABLE
MEMORY
FIXED
MEMORY
slide 28:
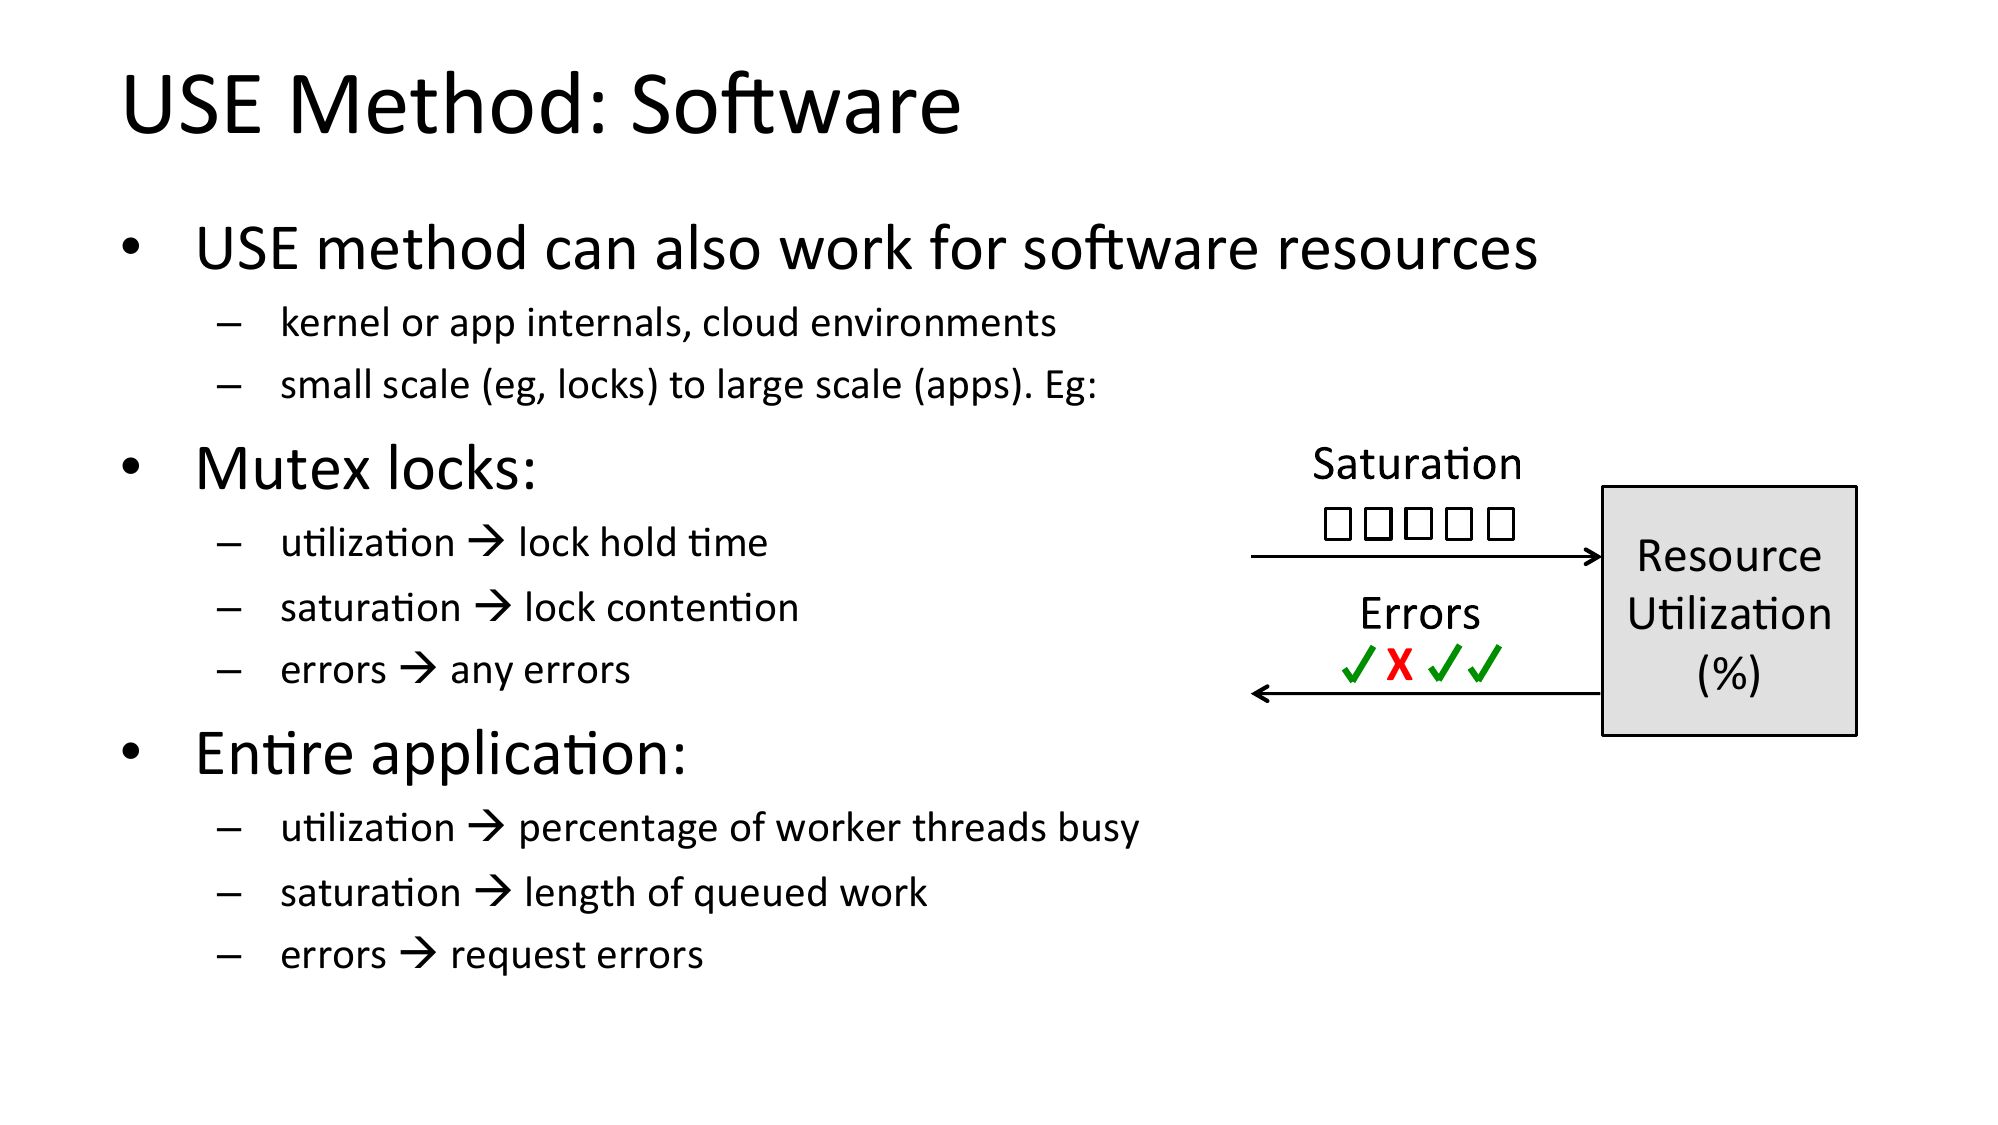
USE Method: SoRware
• USE method can also work for soRware resources
– kernel or app internals, cloud environments
– small scale (eg, locks) to large scale (apps). Eg:
• Mutex locks:
– uNlizaNon à lock hold Nme
– saturaNon à lock contenNon
– errors à any errors
• EnNre applicaNon:
– uNlizaNon à percentage of worker threads busy
– saturaNon à length of queued work
– errors à request errors
Resource
UNlizaNon
(%)
slide 29:
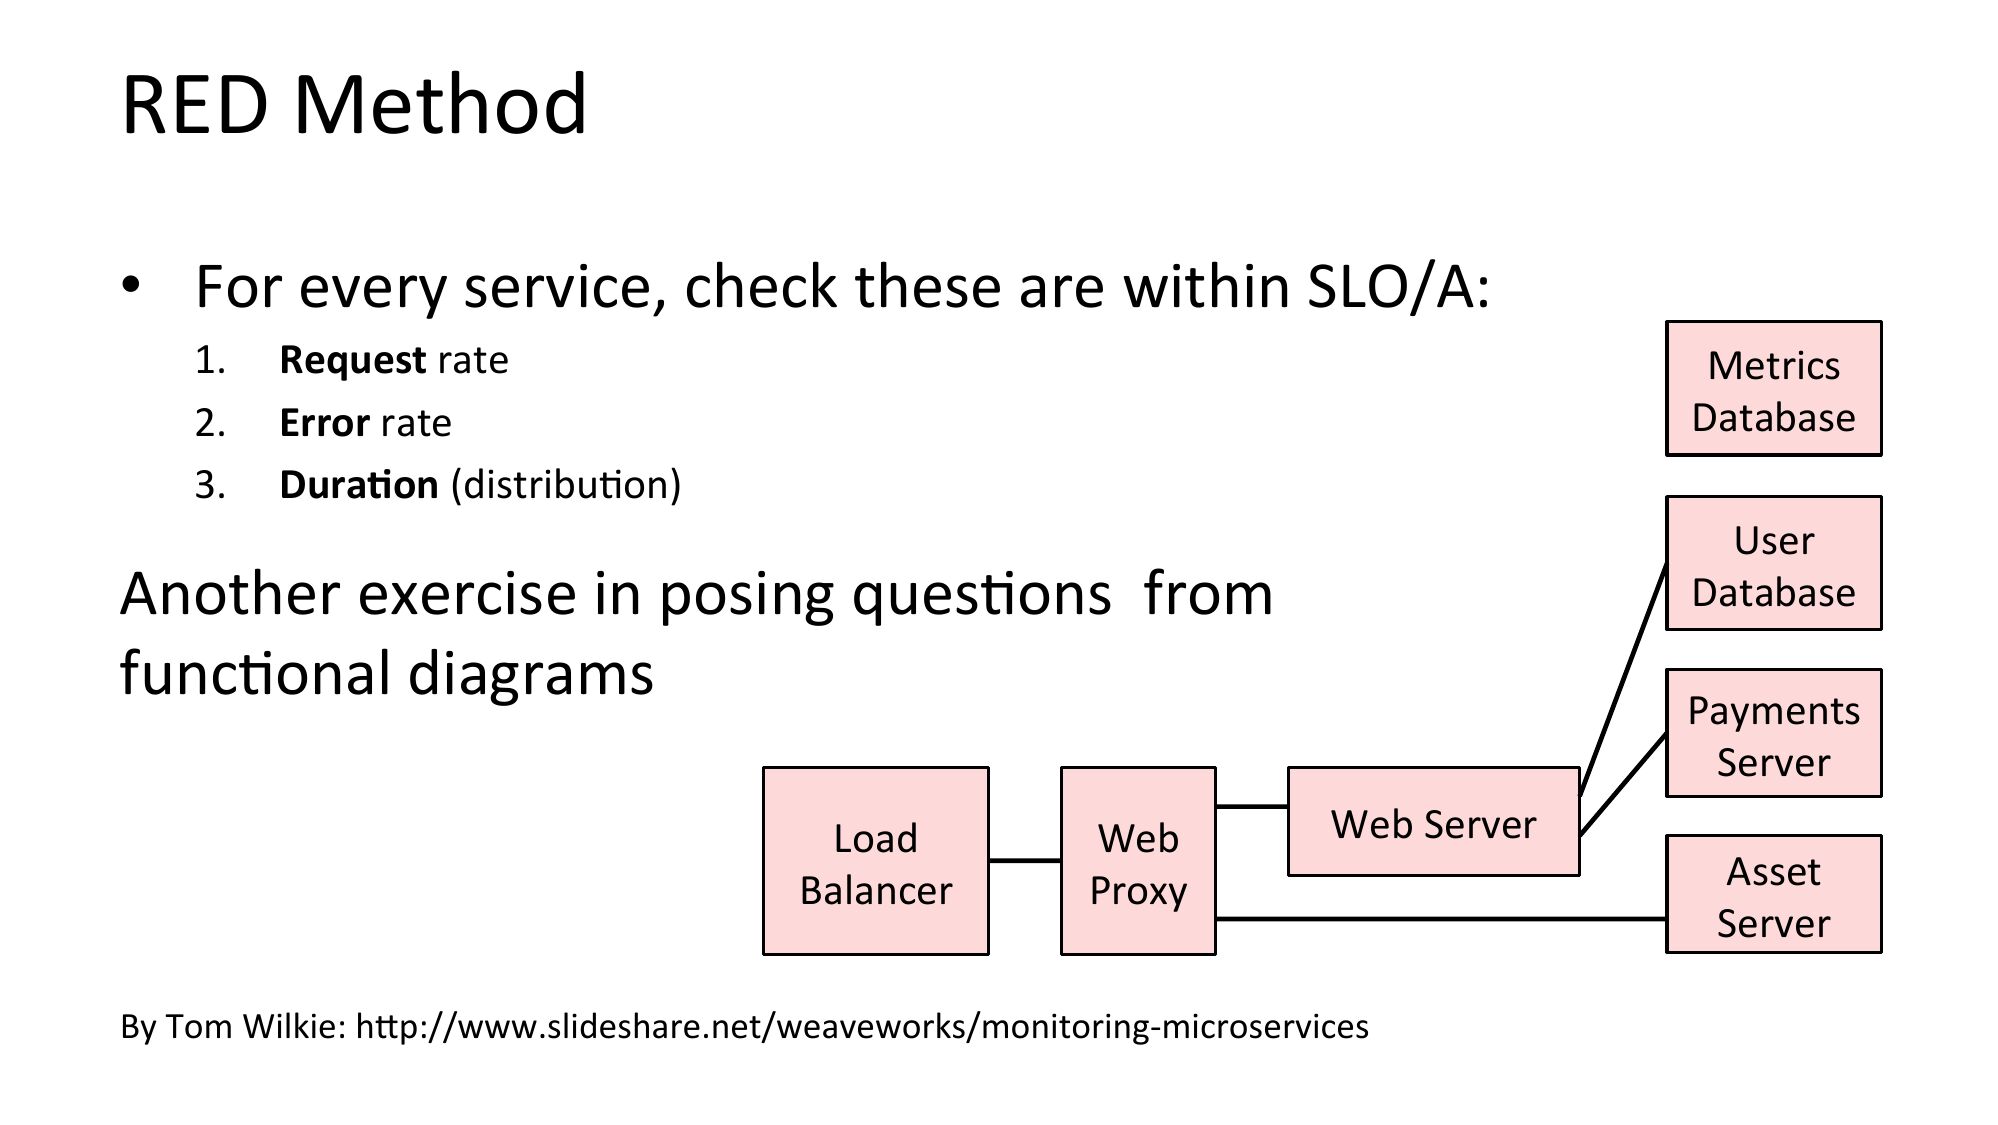
RED Method
• For every service, check these are within SLO/A:
Request rate
Error rate
Dura=on (distribuNon)
Metrics
Database
User
Database
Another exercise in posing quesNons from
funcNonal diagrams
Load
Balancer
Web
Proxy
Payments
Server
Web Server
By Tom Wilkie: hjp://www.slideshare.net/weaveworks/monitoring-microservices
Asset
Server
slide 30:
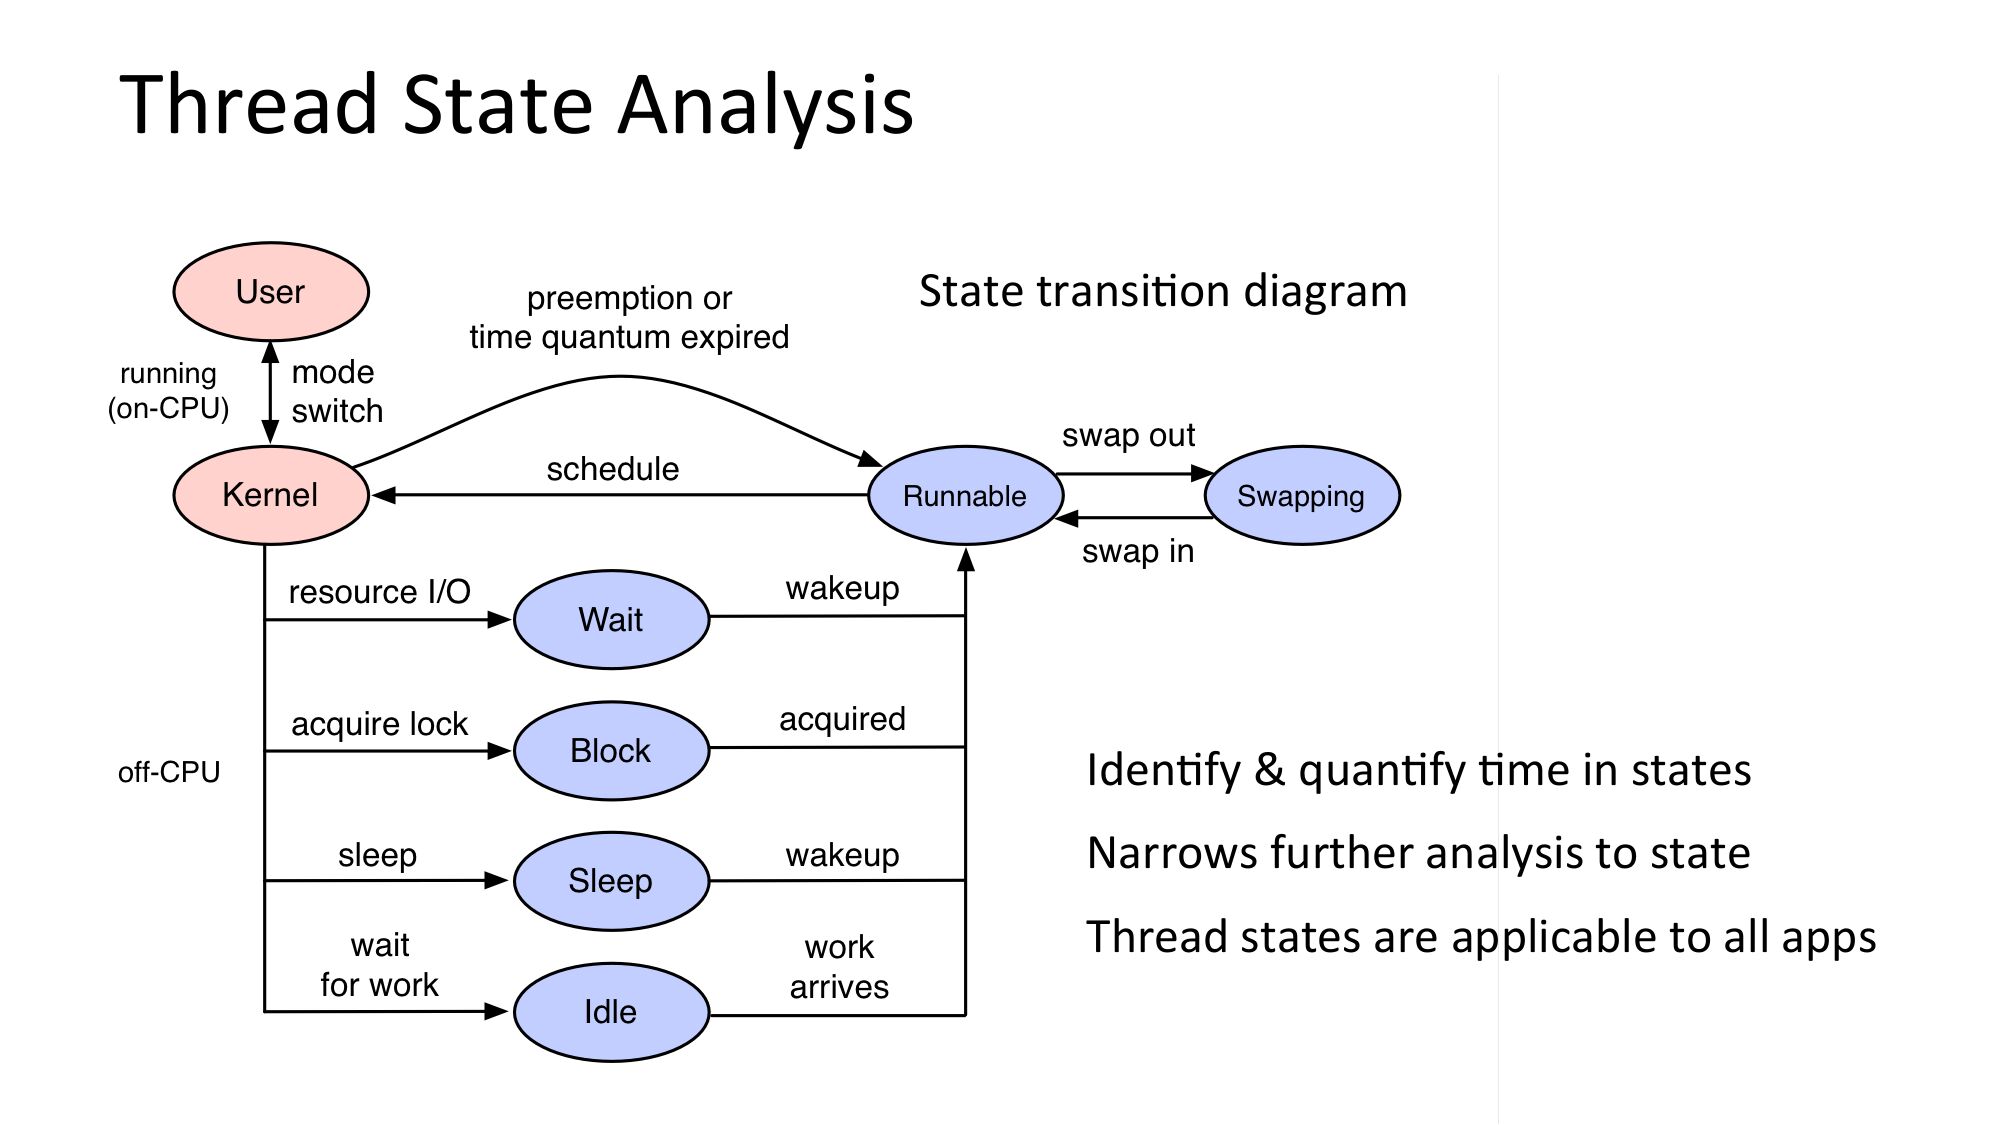
Thread State Analysis
State transiNon diagram
IdenNfy & quanNfy Nme in states
Narrows further analysis to state
Thread states are applicable to all apps
slide 31:
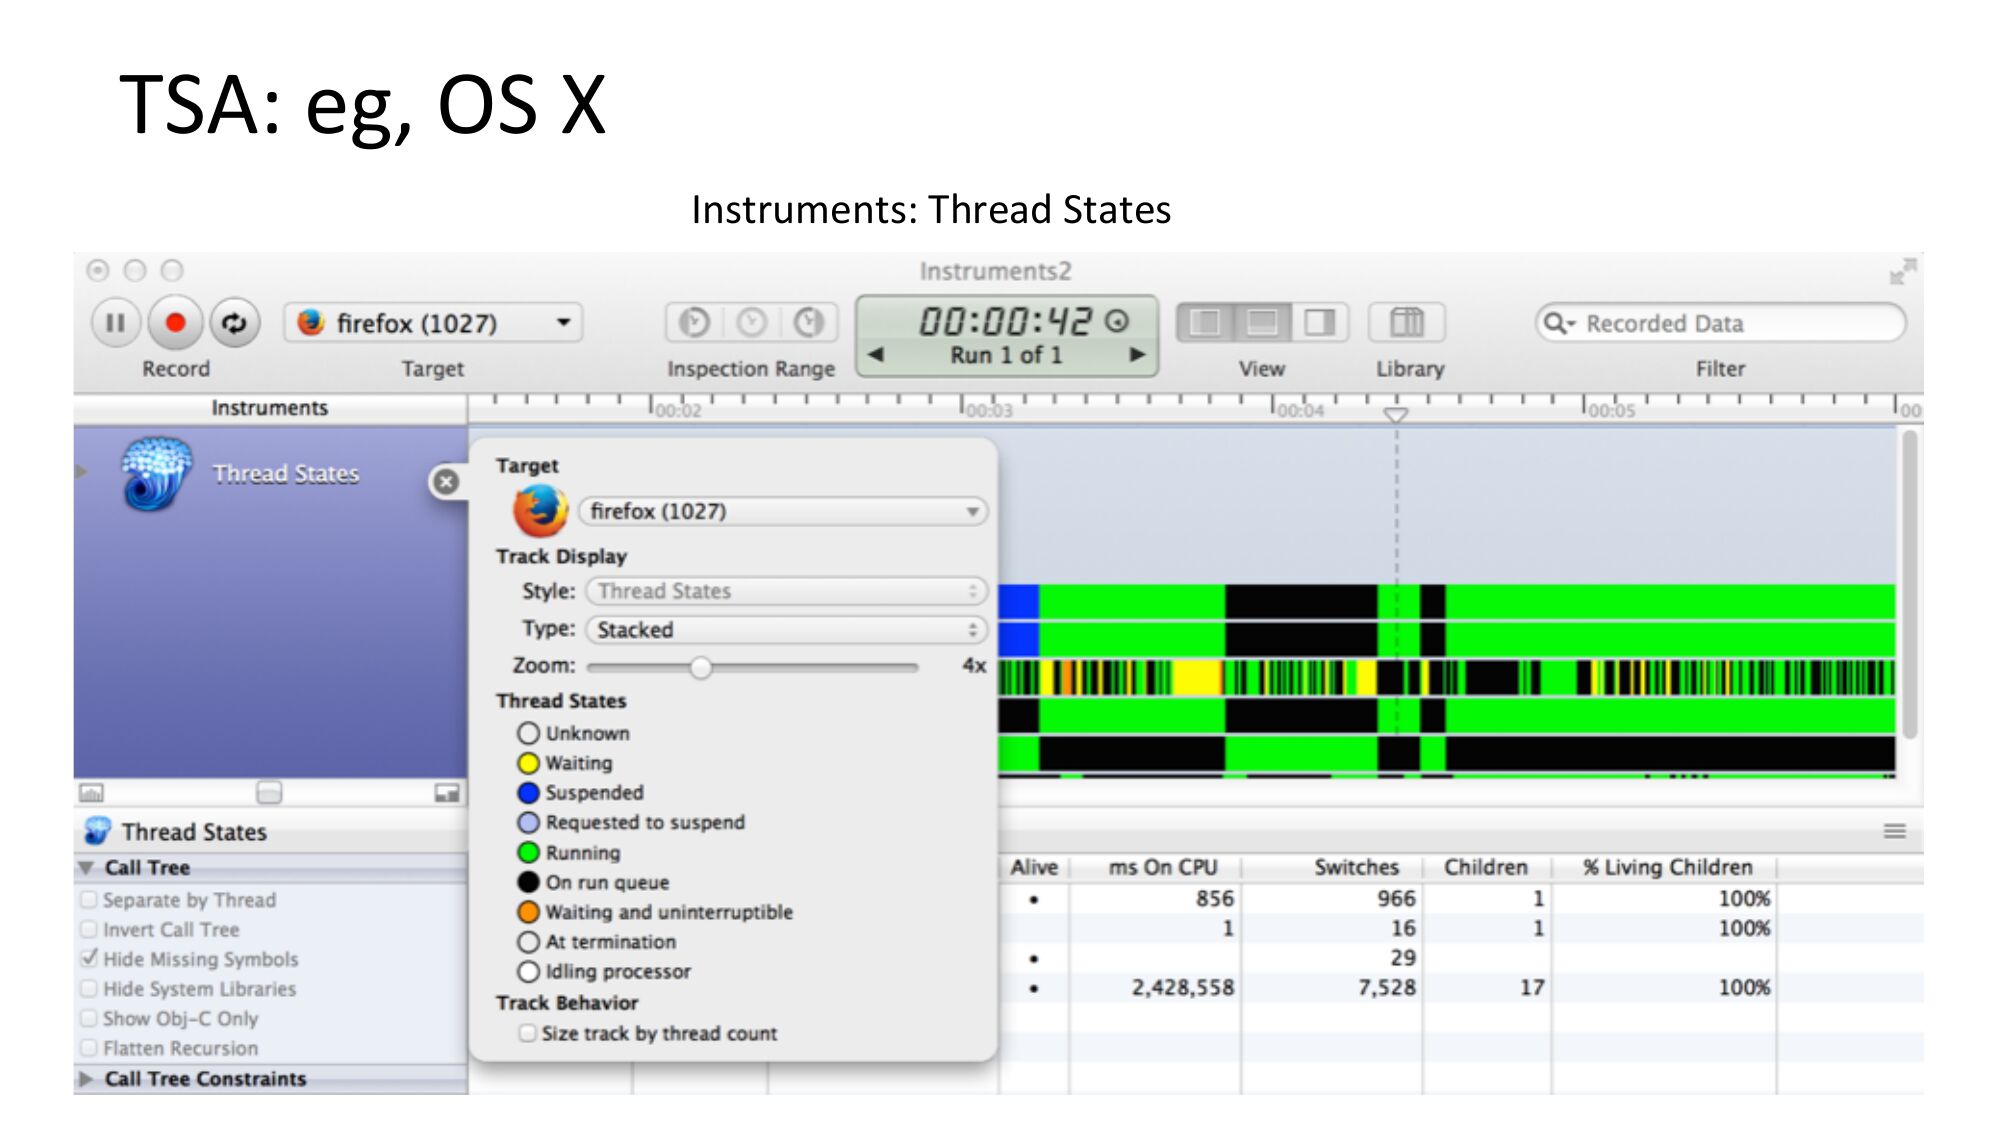
TSA: eg, OS X
Instruments: Thread States
slide 32:
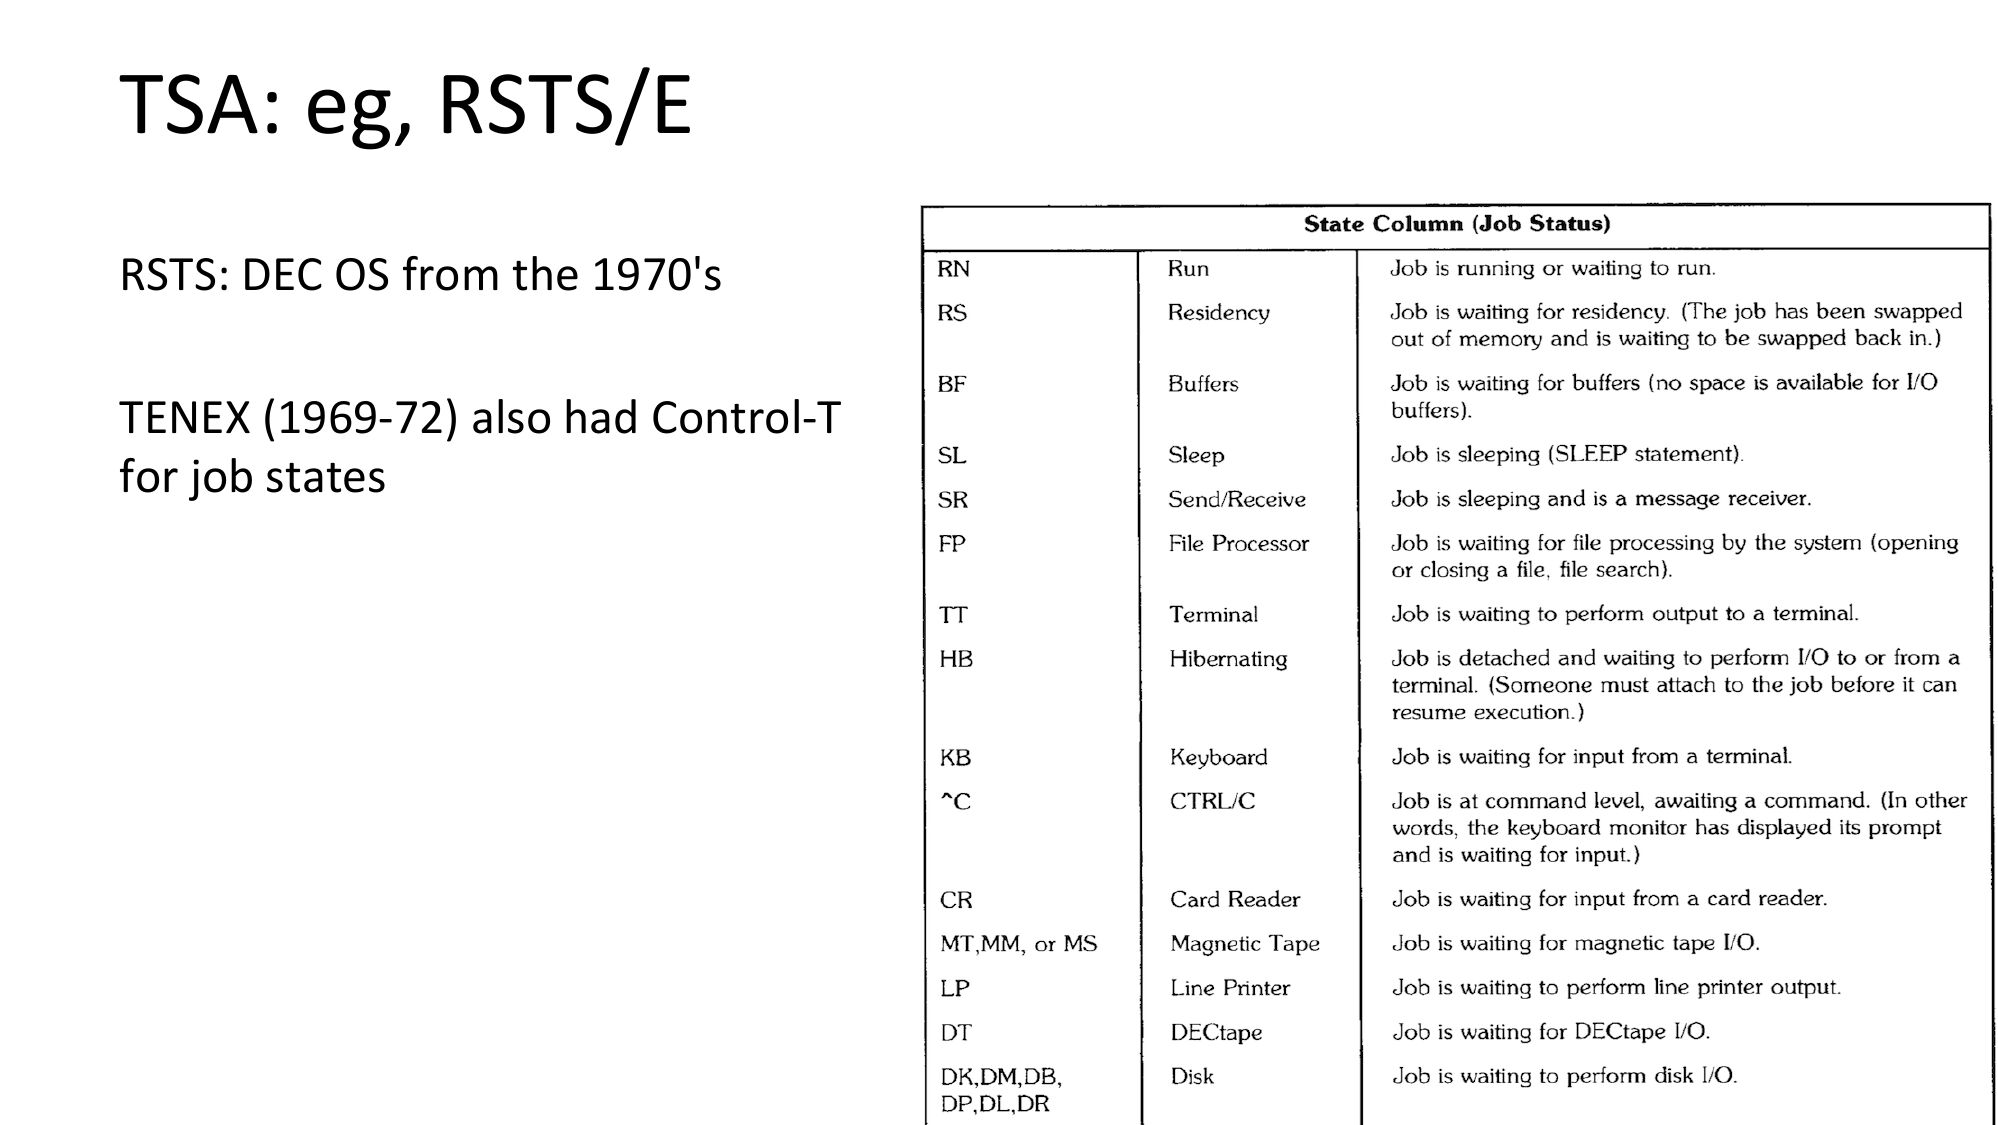
TSA: eg, RSTS/E
RSTS: DEC OS from the 1970's
TENEX (1969-72) also had Control-T
for job states
slide 33:
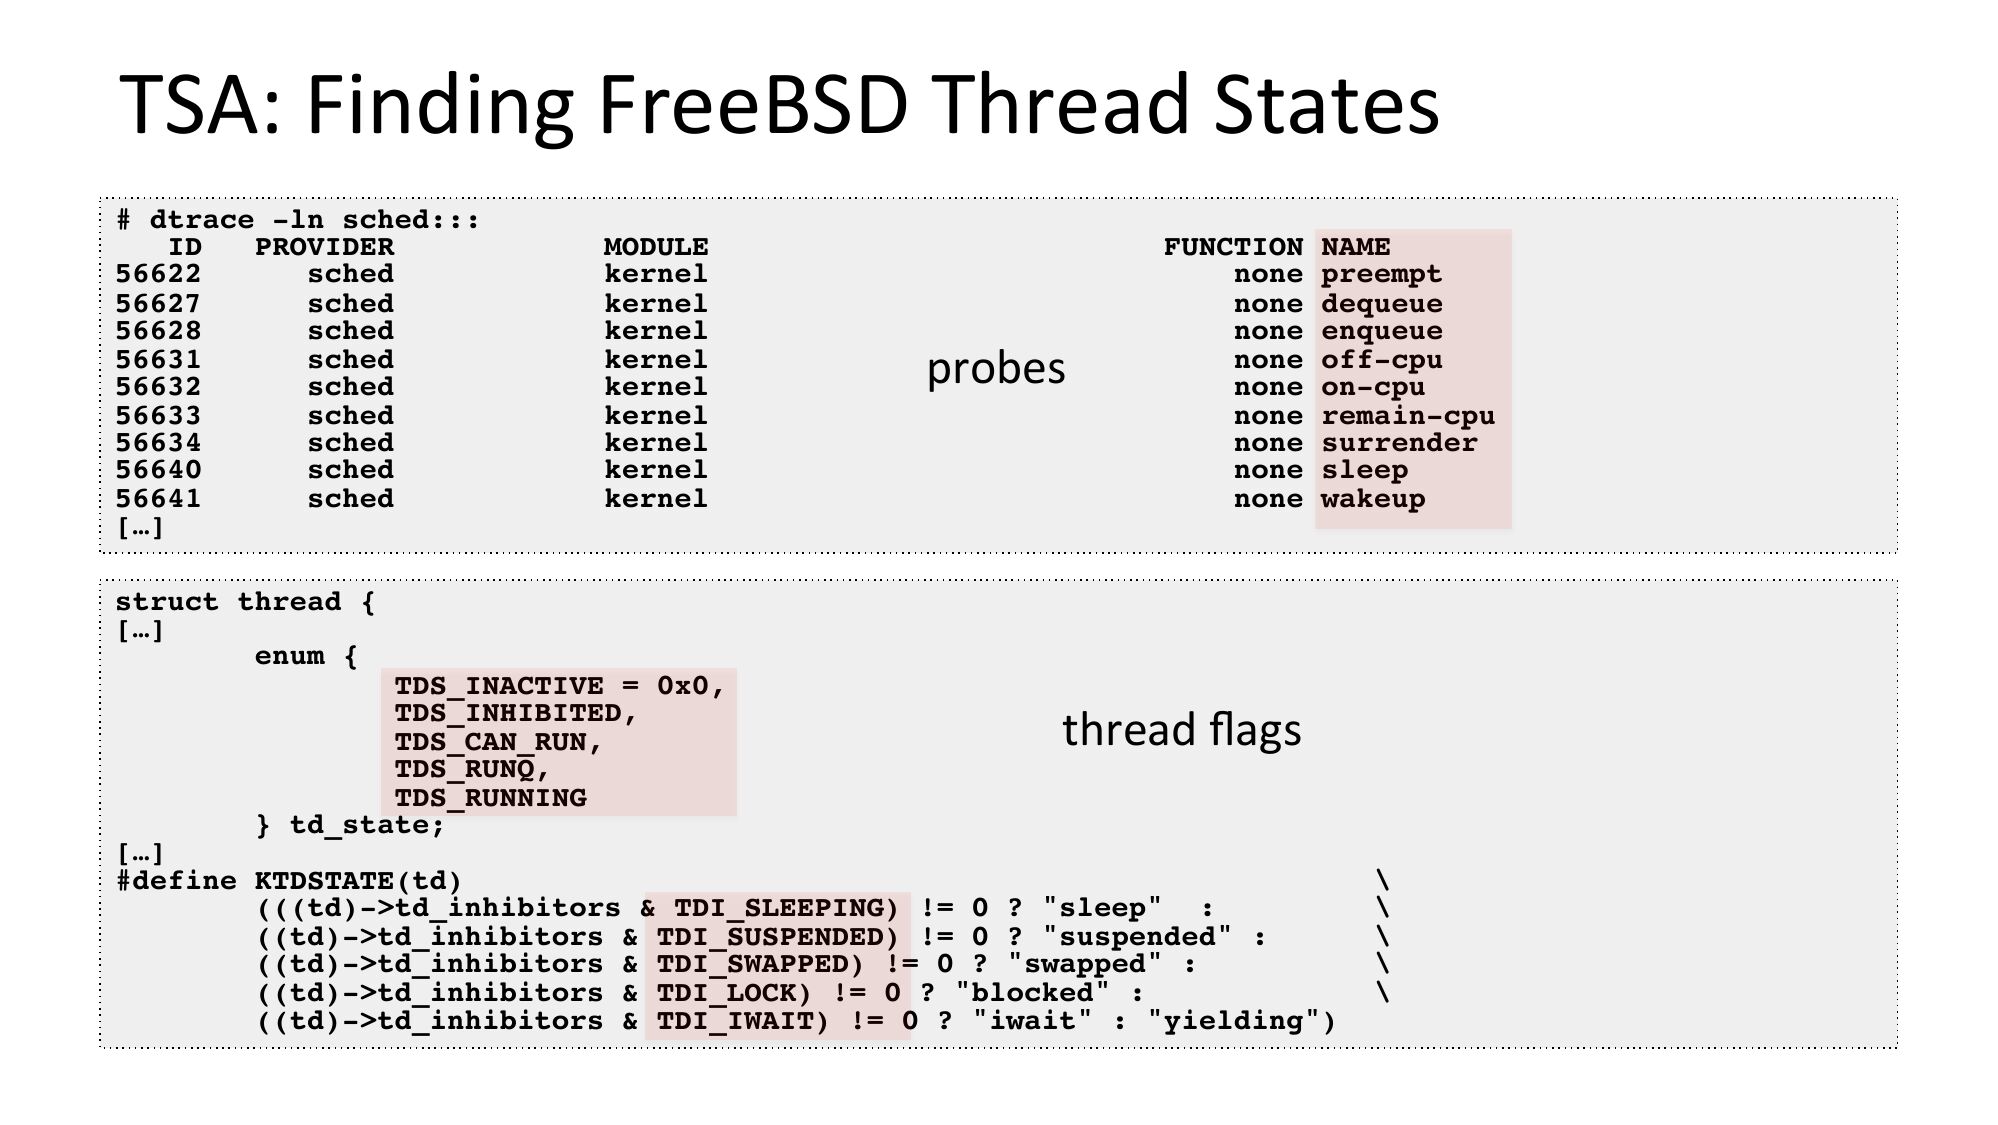
TSA: Finding FreeBSD Thread States
# dtrace -ln sched:::
PROVIDER
sched
sched
sched
sched
sched
sched
sched
sched
sched
[…]
MODULE
kernel
kernel
kernel
kernel
kernel
kernel
kernel
kernel
kernel
probes
FUNCTION NAME
none preempt
none dequeue
none enqueue
none off-cpu
none on-cpu
none remain-cpu
none surrender
none sleep
none wakeup
struct thread {
[…]
enum {
TDS_INACTIVE = 0x0,
TDS_INHIBITED,
TDS_CAN_RUN,
TDS_RUNQ,
TDS_RUNNING
} td_state;
thread flags
[…]
#define KTDSTATE(td)
(((td)->gt;td_inhibitors & TDI_SLEEPING) != 0 ? "sleep" :
((td)->gt;td_inhibitors & TDI_SUSPENDED) != 0 ? "suspended" :
((td)->gt;td_inhibitors & TDI_SWAPPED) != 0 ? "swapped" :
((td)->gt;td_inhibitors & TDI_LOCK) != 0 ? "blocked" :
((td)->gt;td_inhibitors & TDI_IWAIT) != 0 ? "iwait" : "yielding")
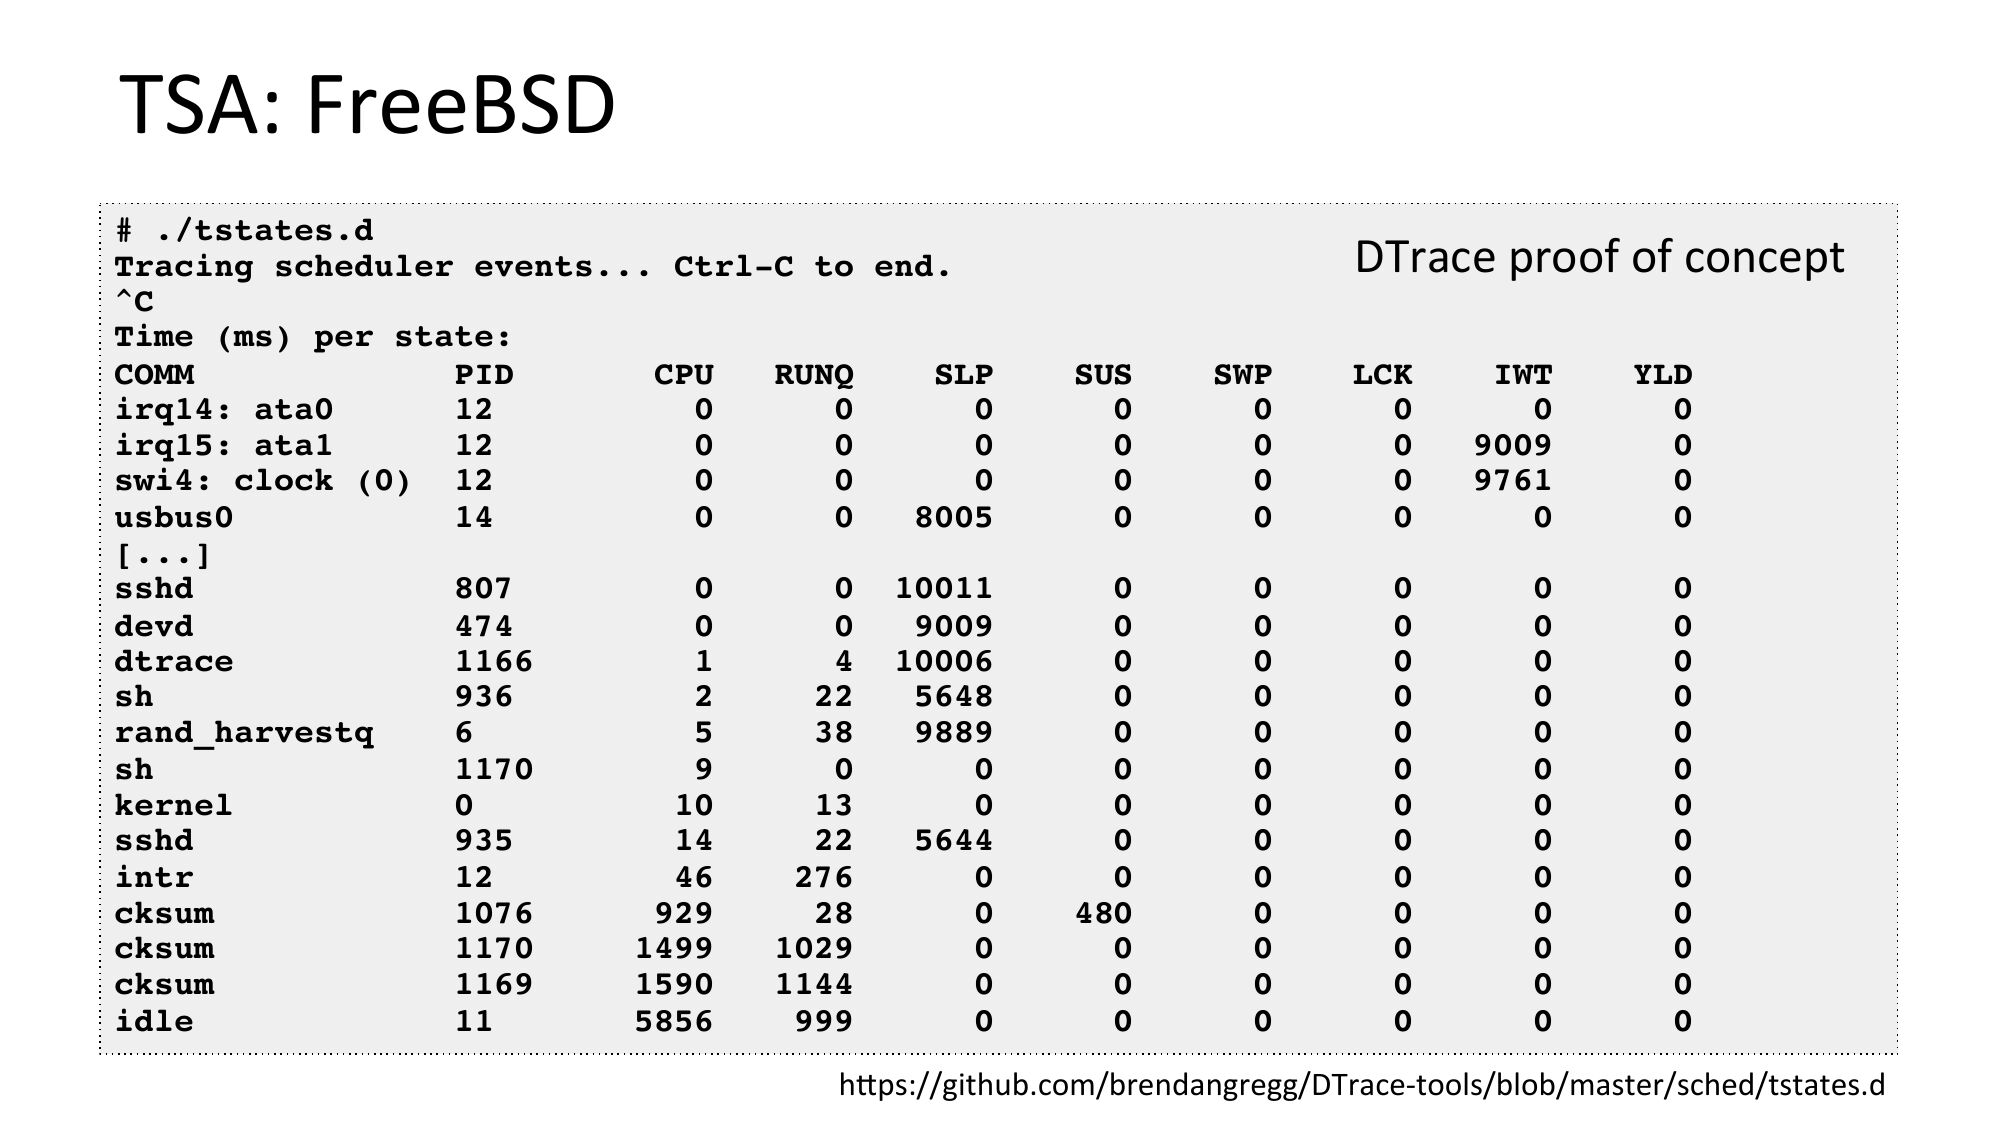
slide 34:TSA: FreeBSD # ./tstates.d Tracing scheduler events... Ctrl-C to end. Time (ms) per state: COMM PID CPU RUNQ SLP irq14: ata0 irq15: ata1 swi4: clock (0) 12 usbus0 [...] sshd 0 10011 devd dtrace 4 10006 rand_harvestq kernel sshd intr cksum cksum cksum idle DTrace proof of concept SUS SWP LCK IWT YLD hjps://github.com/brendangregg/DTrace-tools/blob/master/sched/tstates.dslide 35:
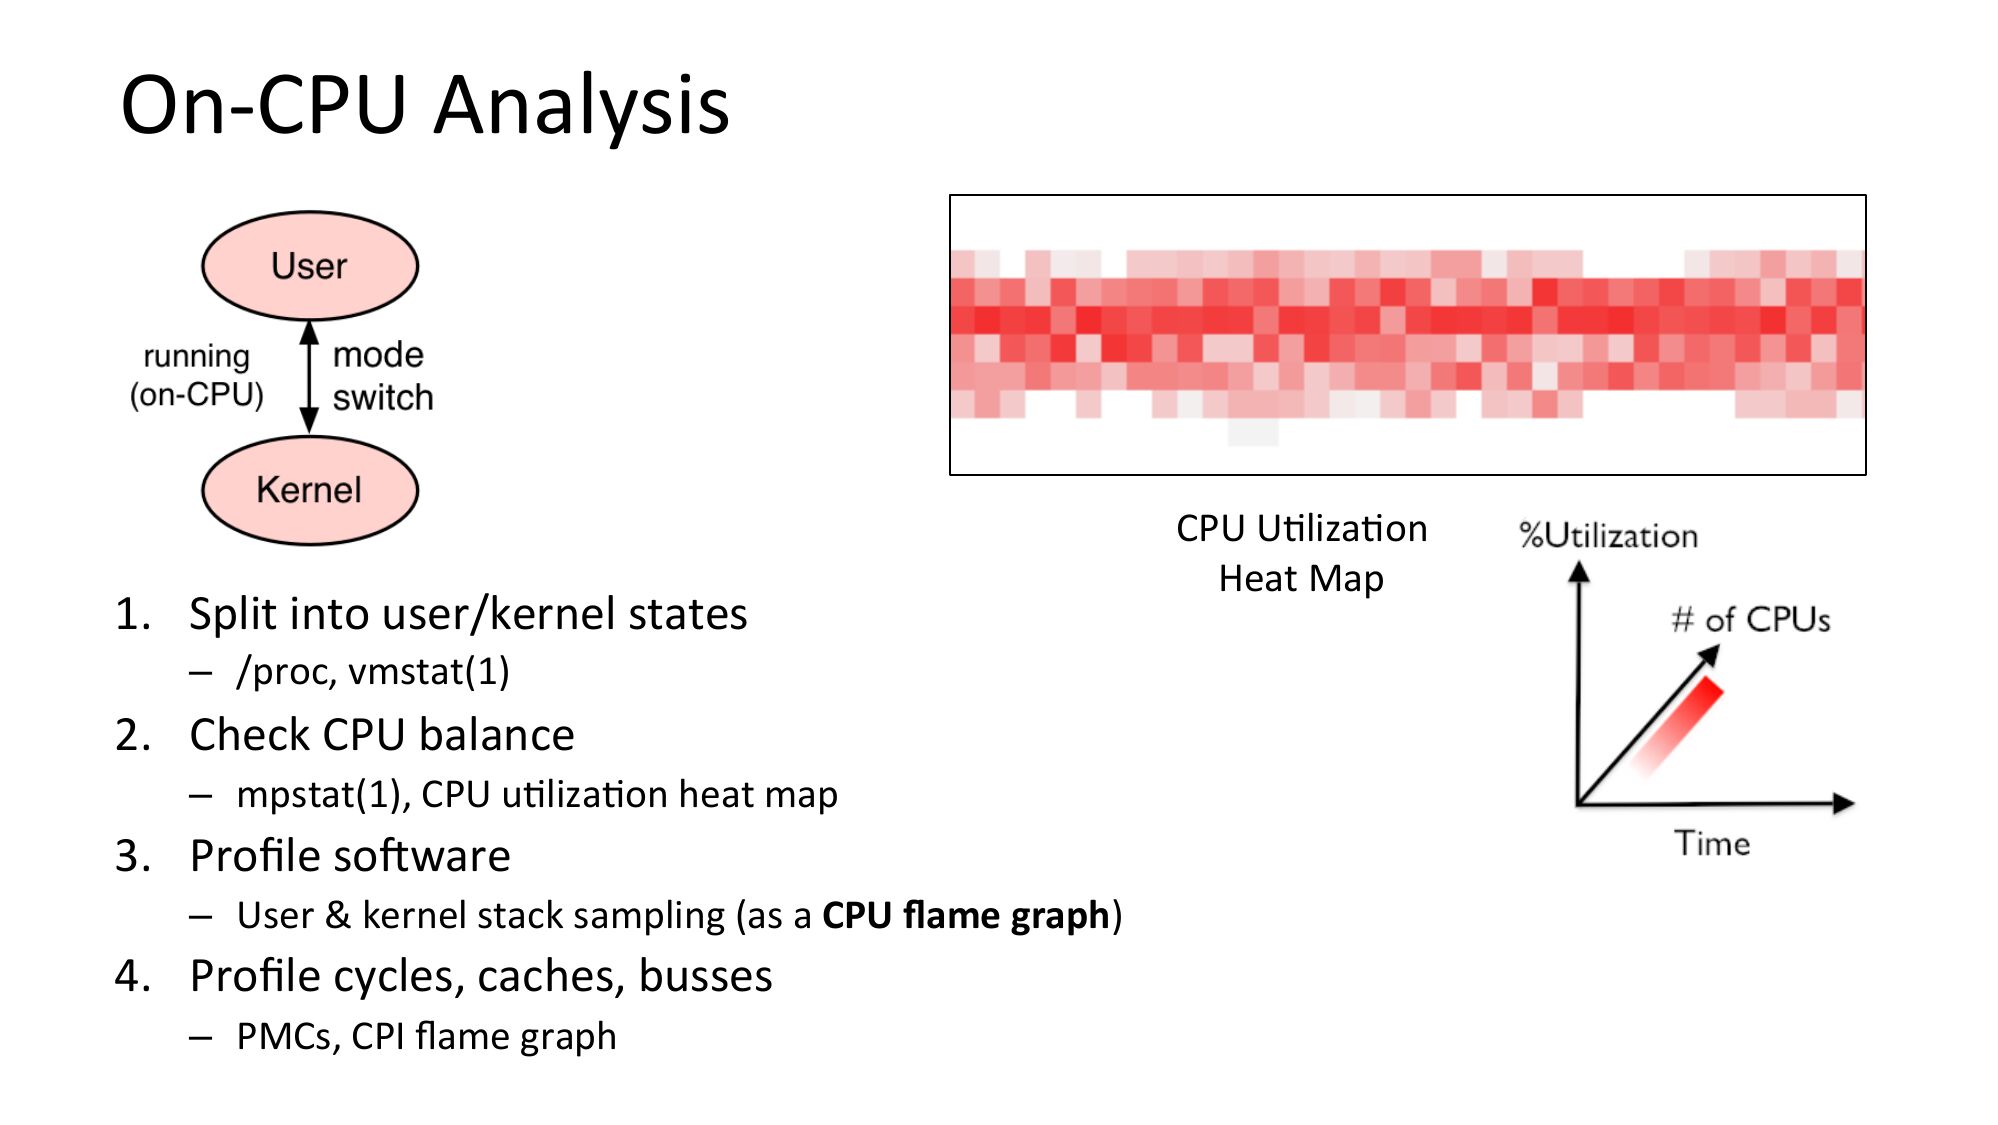
On-CPU Analysis
1. Split into user/kernel states
– /proc, vmstat(1)
2. Check CPU balance
– mpstat(1), CPU uNlizaNon heat map
3. Profile soRware
– User & kernel stack sampling (as a CPU flame graph)
4. Profile cycles, caches, busses
– PMCs, CPI flame graph
CPU UNlizaNon
Heat Map
slide 36:
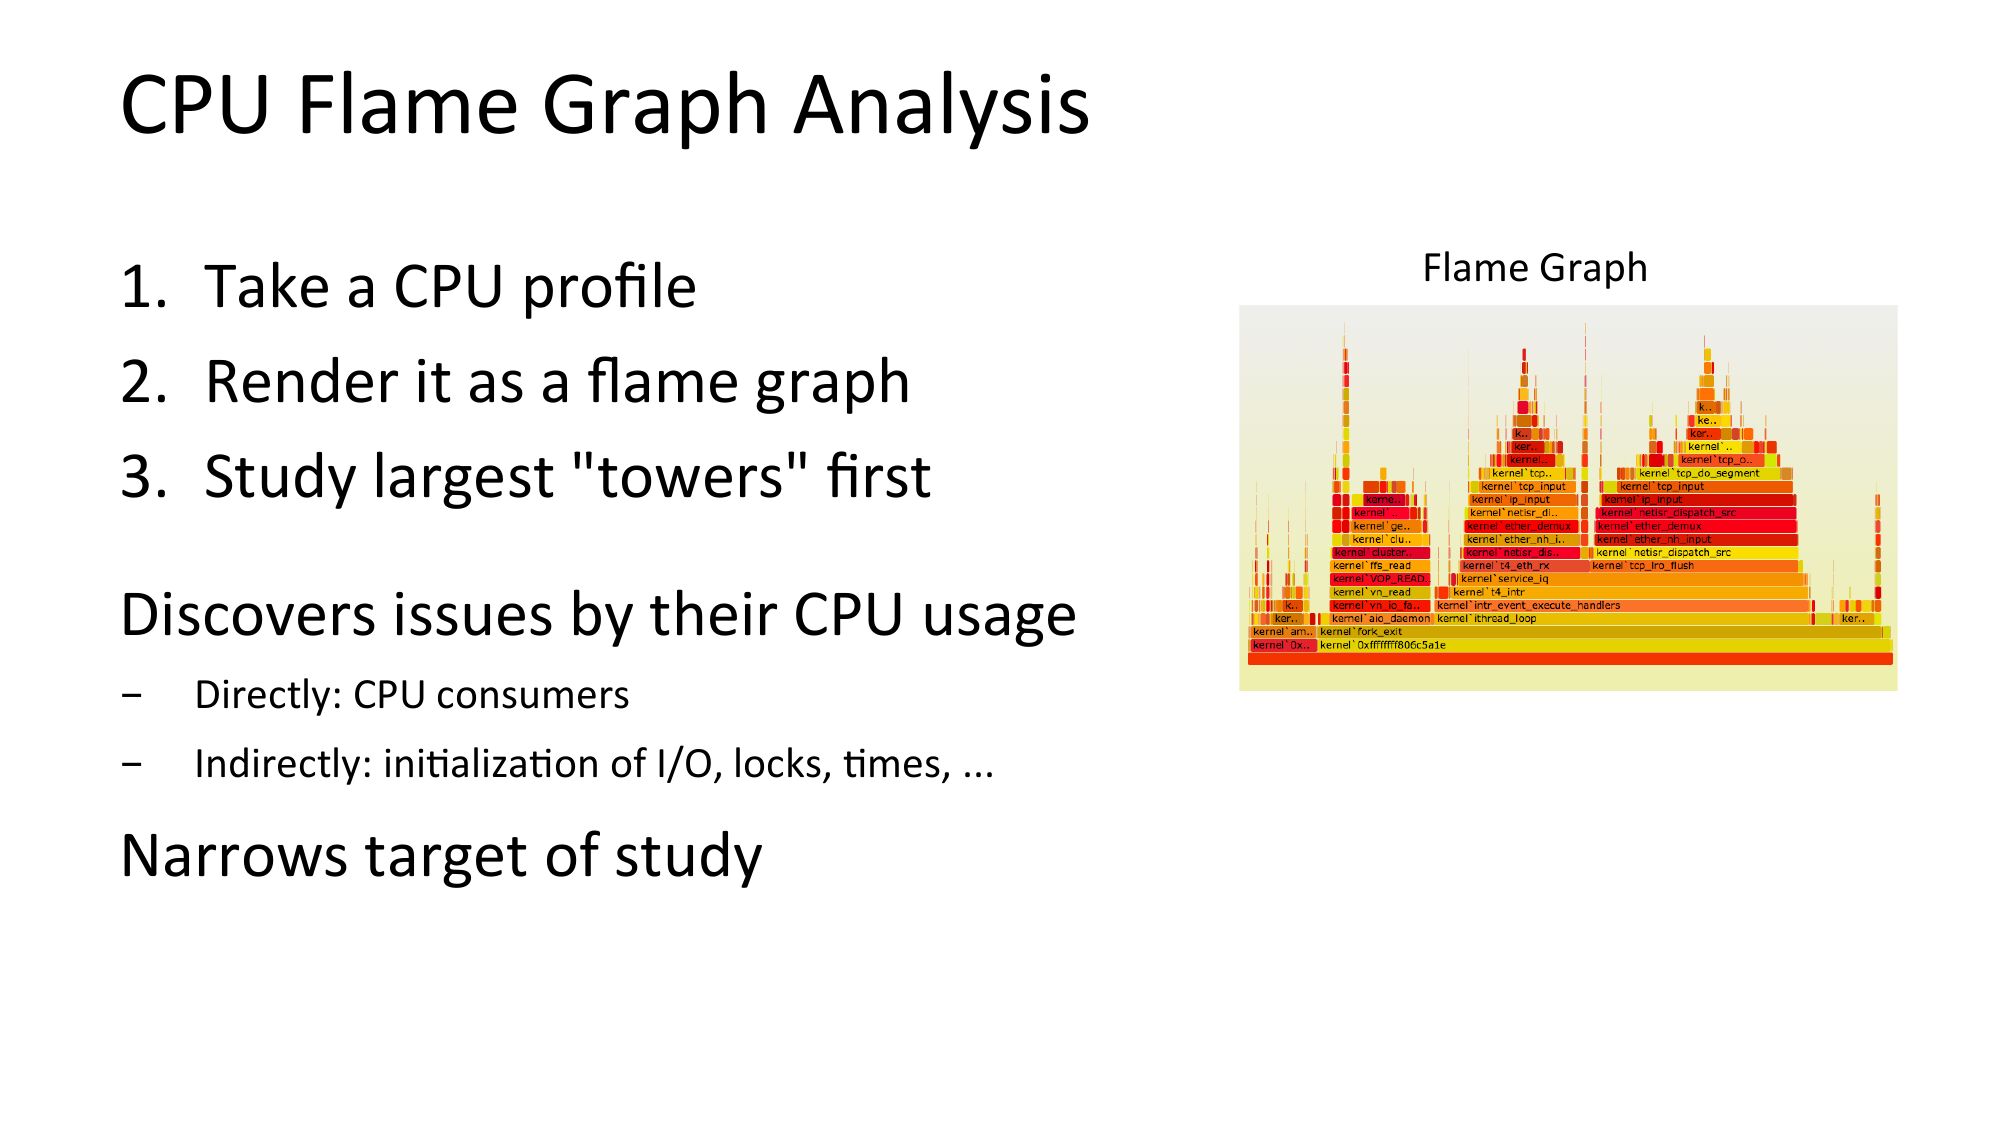
CPU Flame Graph Analysis
1. Take a CPU profile
2. Render it as a flame graph
3. Study largest "towers" first
Discovers issues by their CPU usage
Directly: CPU consumers
Indirectly: iniNalizaNon of I/O, locks, Nmes, ...
Narrows target of study
Flame Graph
slide 37:
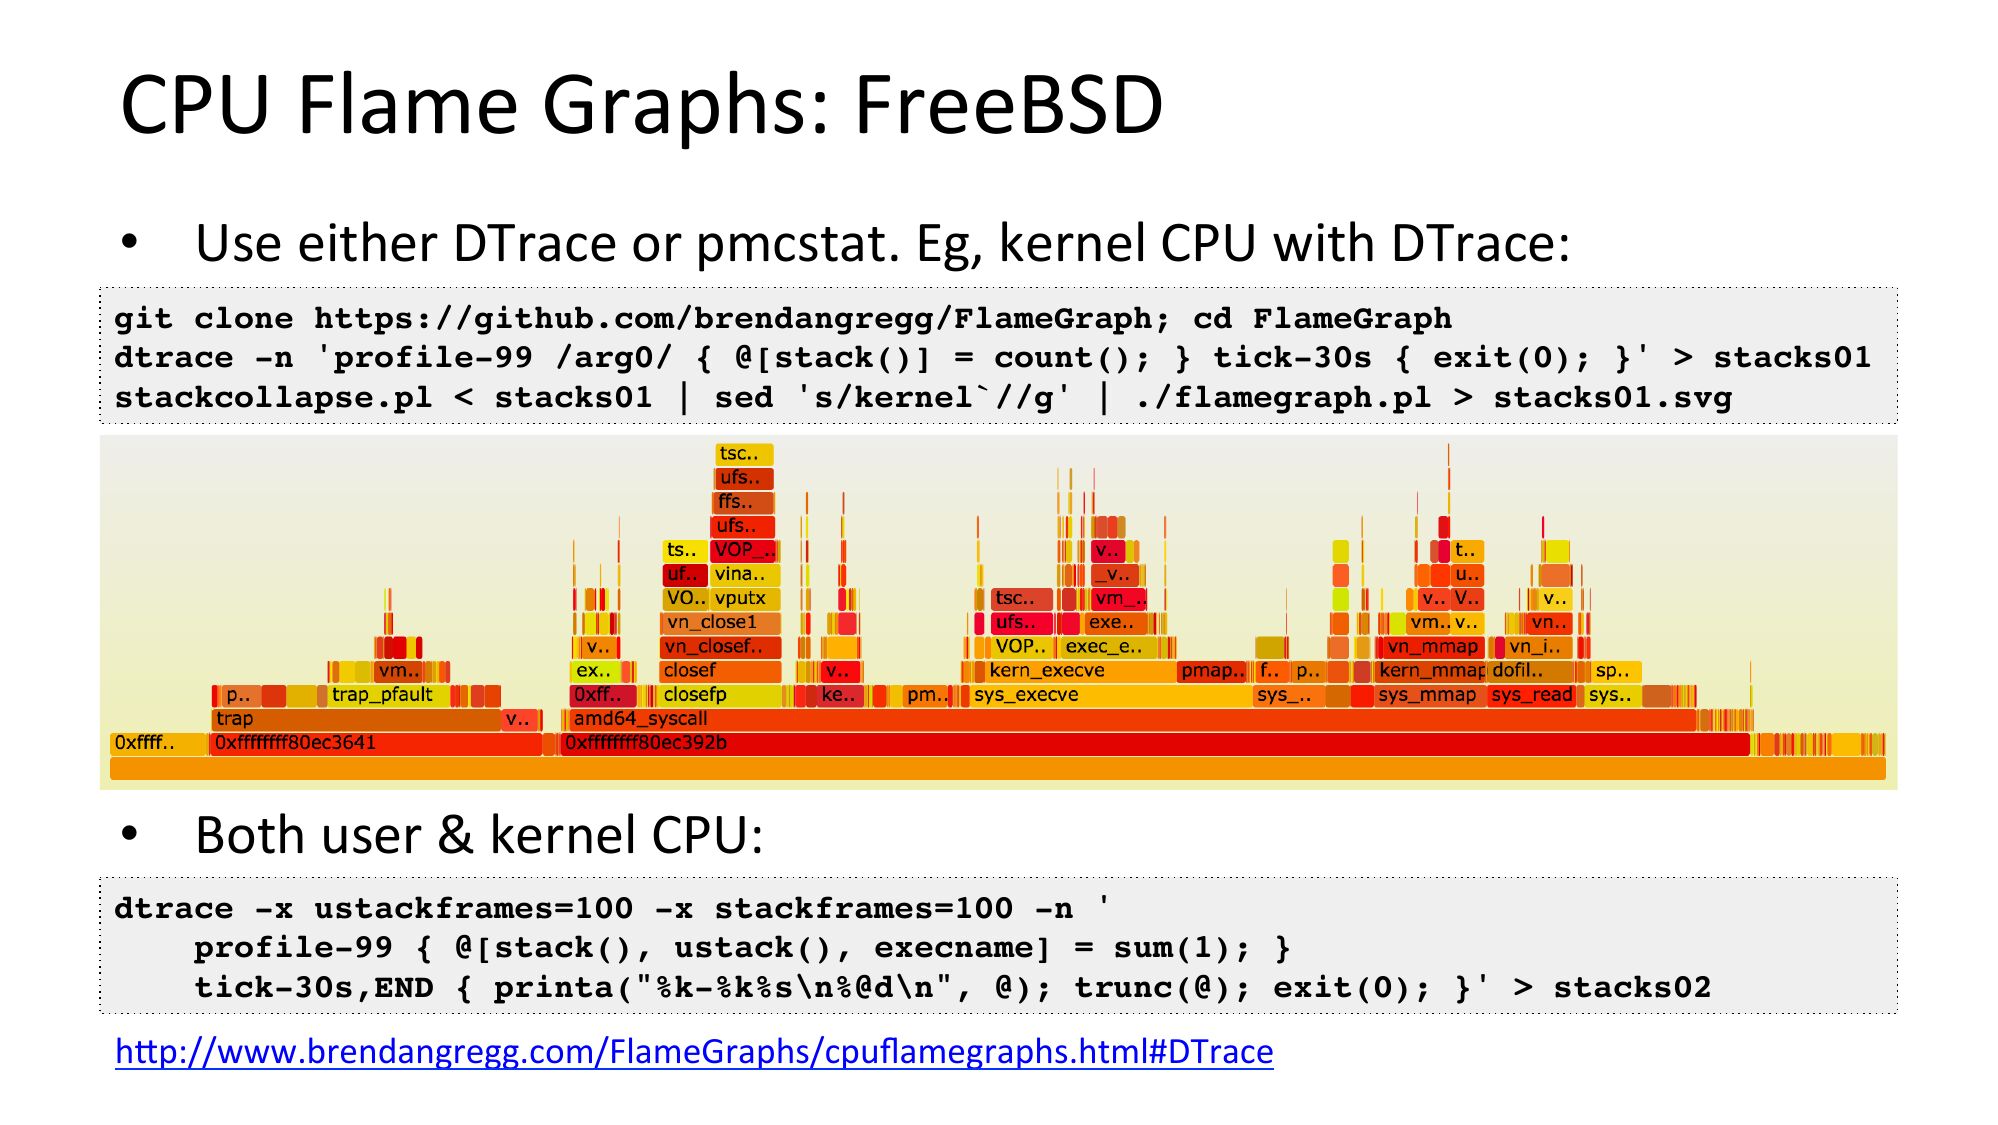
CPU Flame Graphs: FreeBSD
• Use either DTrace or pmcstat. Eg, kernel CPU with DTrace:
git clone https://github.com/brendangregg/FlameGraph; cd FlameGraph
dtrace -n 'profile-99 /arg0/ { @[stack()] = count(); } tick-30s { exit(0); }' >gt; stacks01
stackcollapse.pl gt; stacks01.svg
• Both user & kernel CPU:
dtrace -x ustackframes=100 -x stackframes=100 -n '
profile-99 { @[stack(), ustack(), execname] = sum(1); }
tick-30s,END { printa("%k-%k%s\n%@d\n", @); trunc(@); exit(0); }' >gt; stacks02
hjp://www.brendangregg.com/FlameGraphs/cpuflamegraphs.html#DTrace
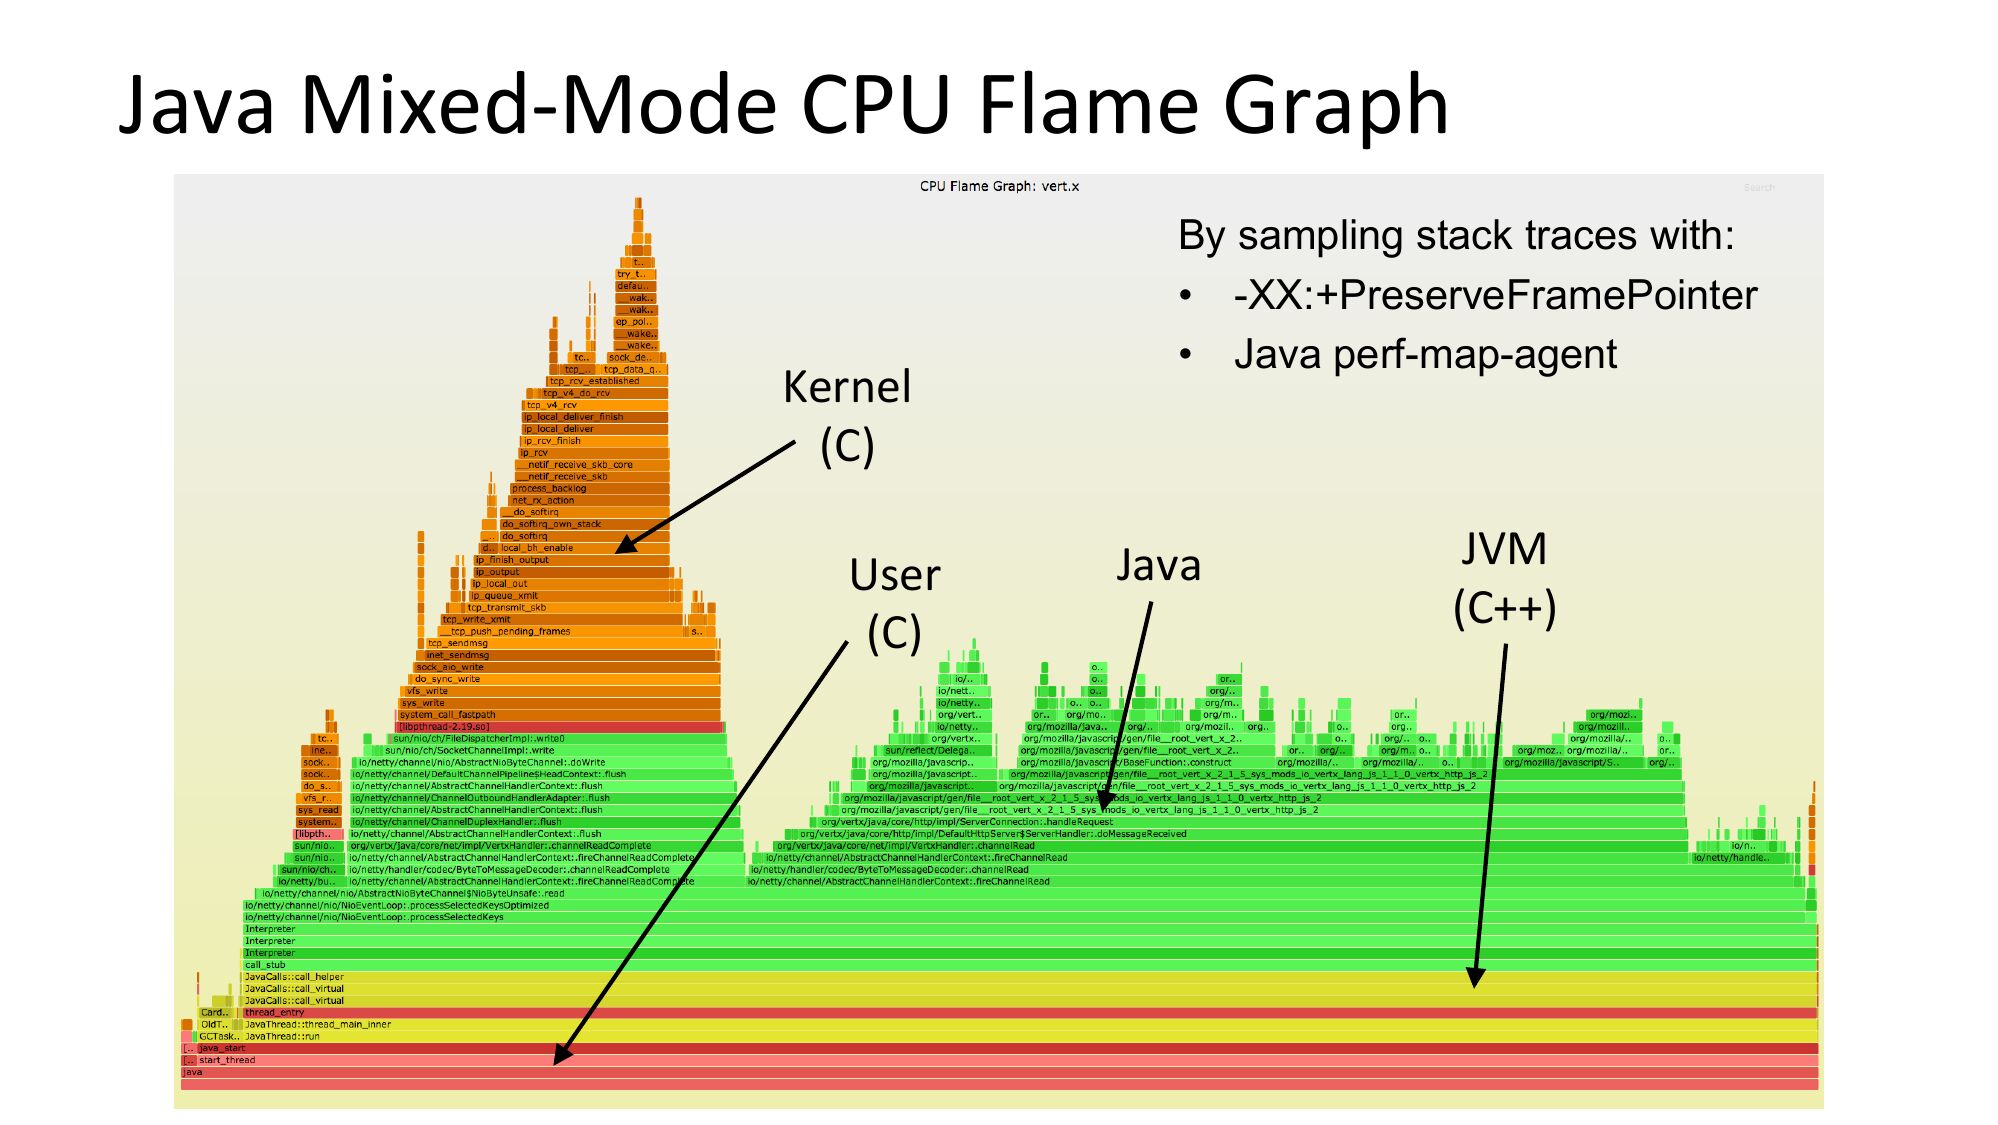
slide 38:Java Mixed-Mode CPU Flame Graph Kernel (C) User (C) By sampling stack traces with: • -XX:+PreserveFramePointer • Java perf-map-agent Java JVM (C++)slide 39:
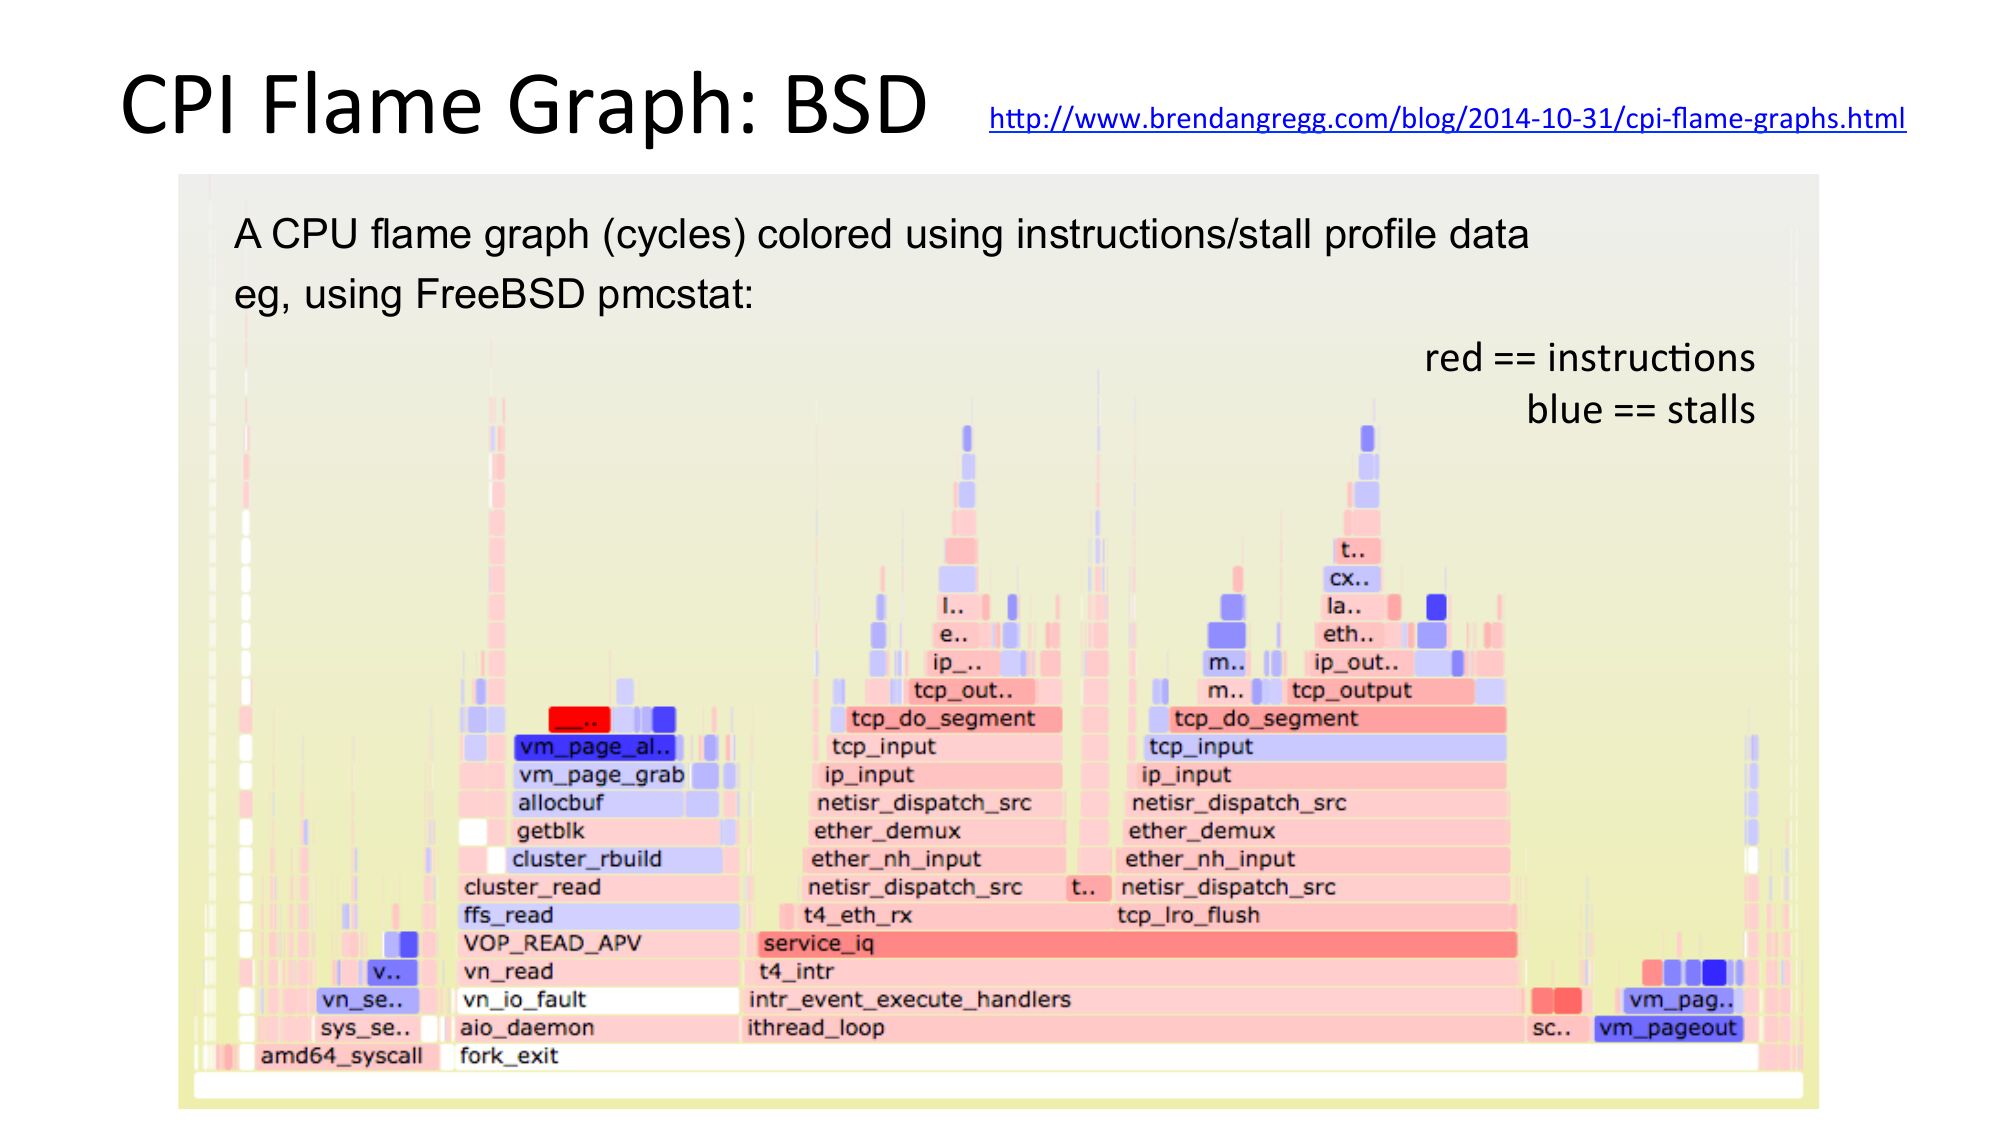
CPI Flame Graph: BSD
hjp://www.brendangregg.com/blog/2014-10-31/cpi-flame-graphs.html
A CPU flame graph (cycles) colored using instructions/stall profile data
eg, using FreeBSD pmcstat:
red == instrucNons
blue == stalls
slide 40:
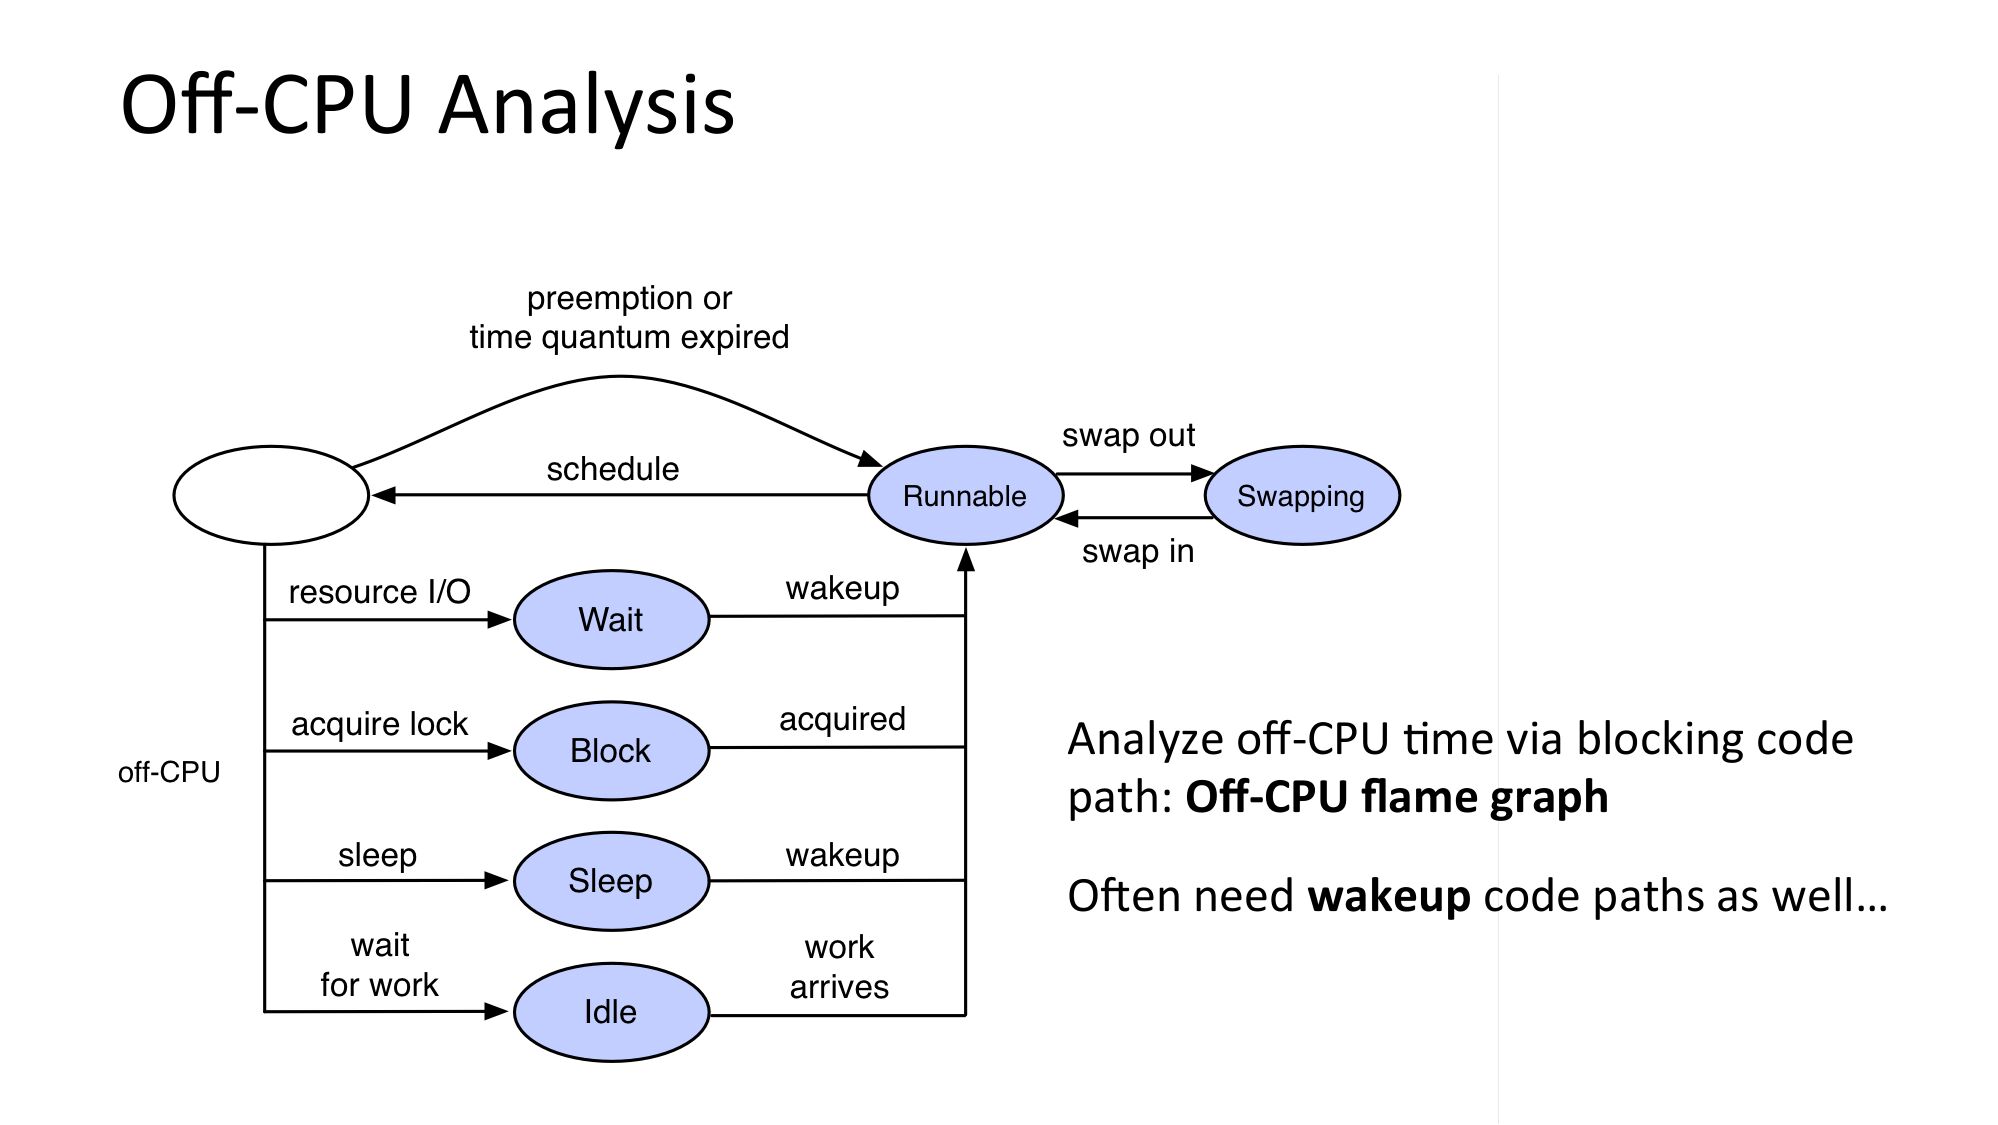
Off-CPU Analysis
Analyze off-CPU Nme via blocking code
path: Off-CPU flame graph
ORen need wakeup code paths as well…
slide 41:
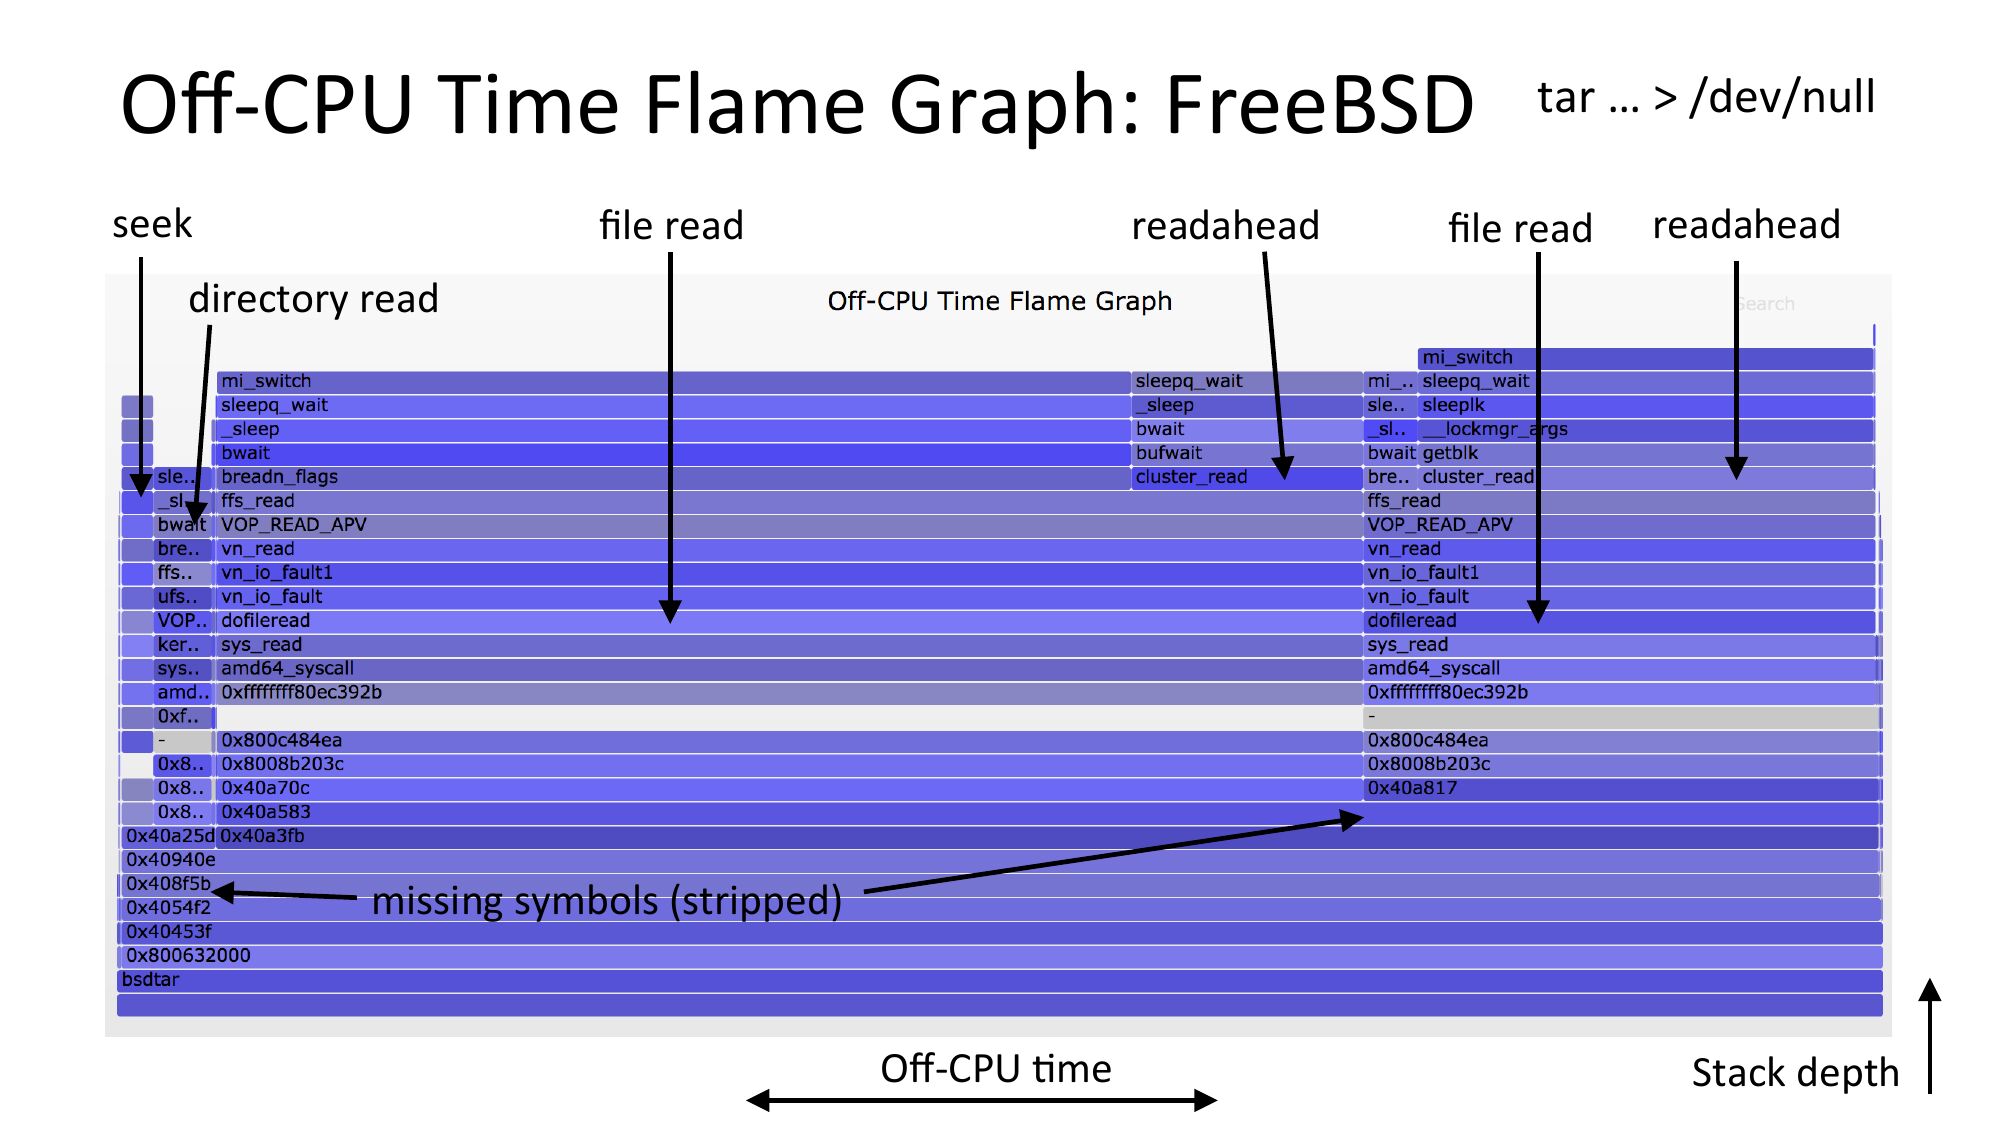
Off-CPU Time Flame Graph: FreeBSD tar … >gt; /dev/null
seek
readahead
file read
file read
readahead
directory read
missing symbols (stripped)
Off-CPU Nme
Stack depth
slide 42:
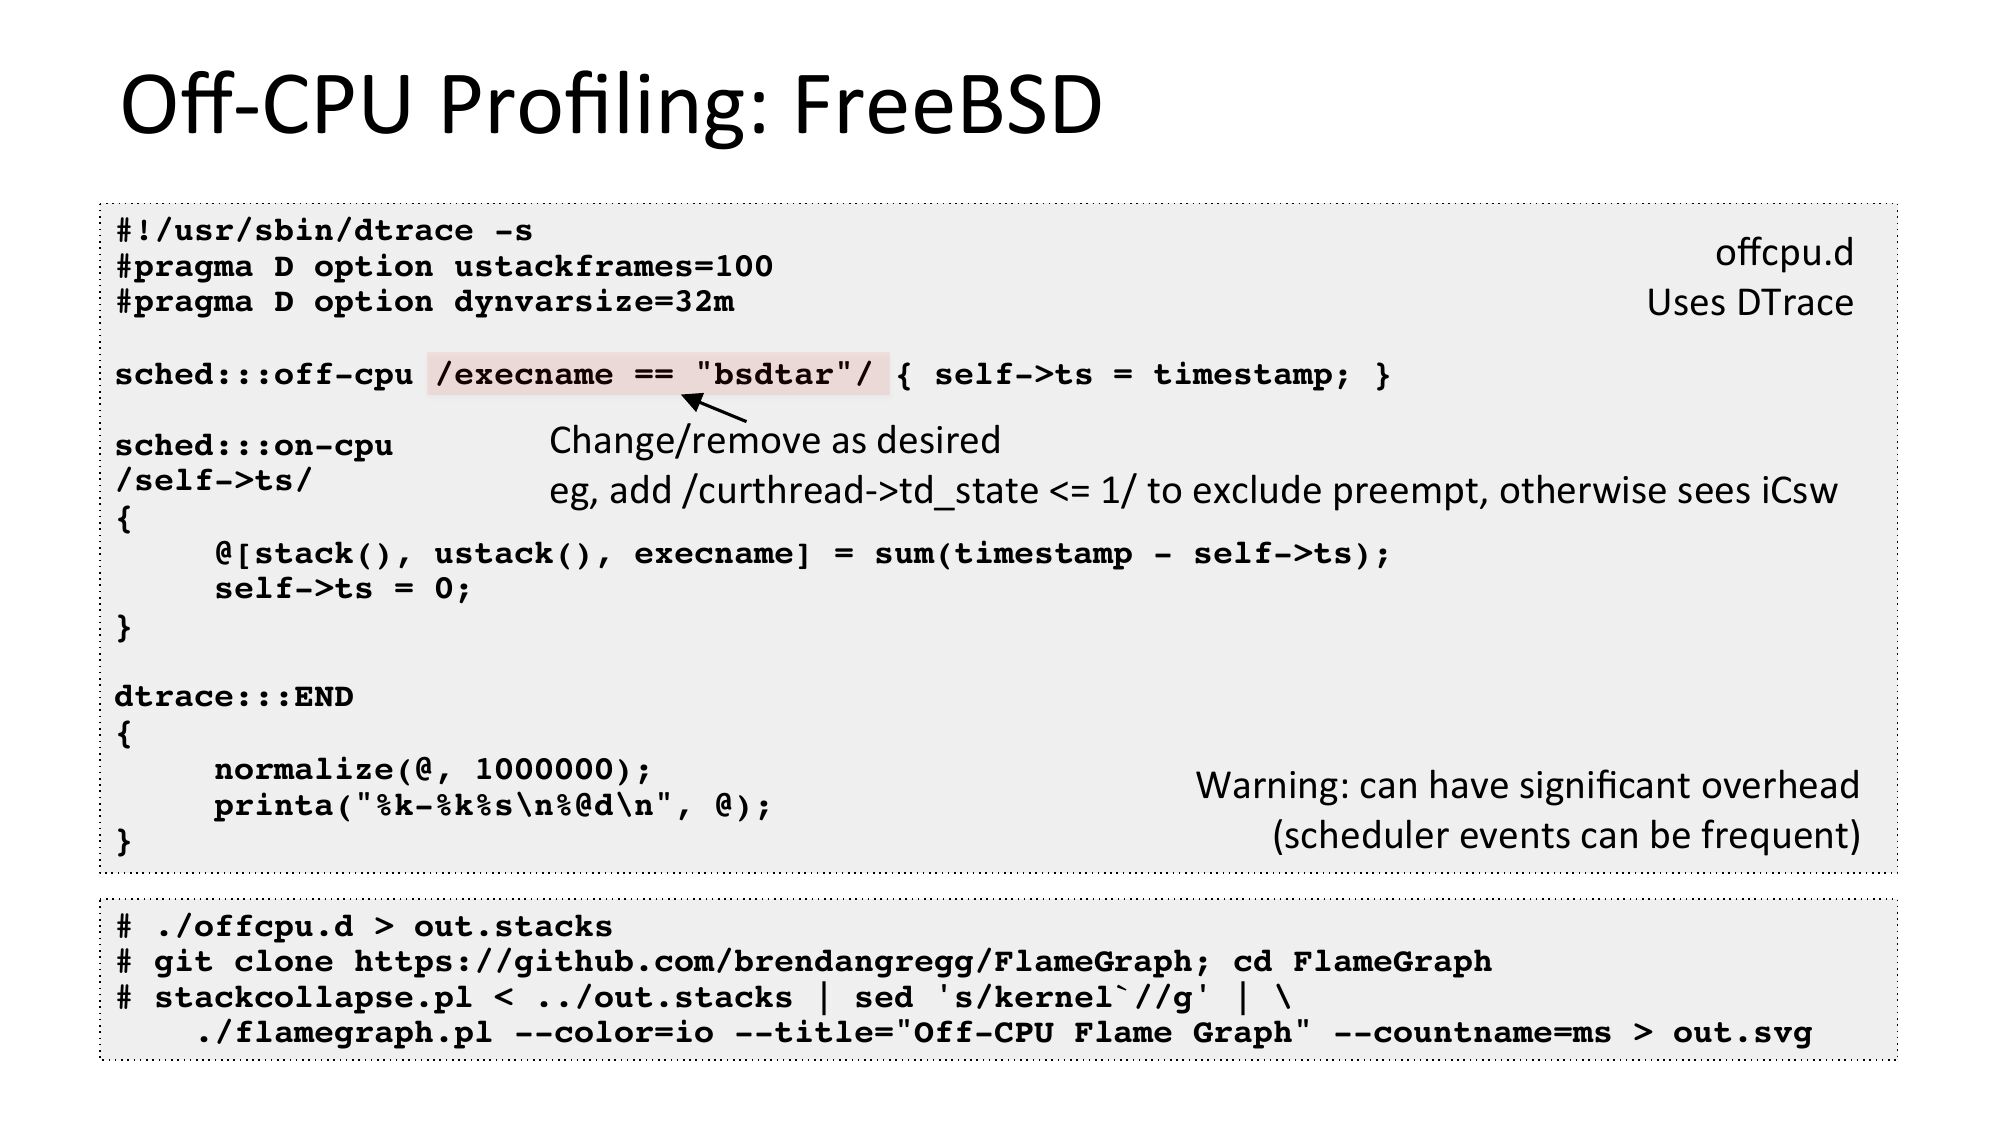
Off-CPU Profiling: FreeBSD
#!/usr/sbin/dtrace -s
#pragma D option ustackframes=100
#pragma D option dynvarsize=32m
offcpu.d
Uses DTrace
sched:::off-cpu /execname == "bsdtar"/ { self->gt;ts = timestamp; }
Change/remove as desired
sched:::on-cpu
/self->gt;ts/
eg, add /curthread->gt;td_state gt;ts);
self->gt;ts = 0;
dtrace:::END
normalize(@, 1000000);
printa("%k-%k%s\n%@d\n", @);
Warning: can have significant overhead
(scheduler events can be frequent)
# ./offcpu.d >gt; out.stacks
# git clone https://github.com/brendangregg/FlameGraph; cd FlameGraph
# stackcollapse.pl gt; out.svg
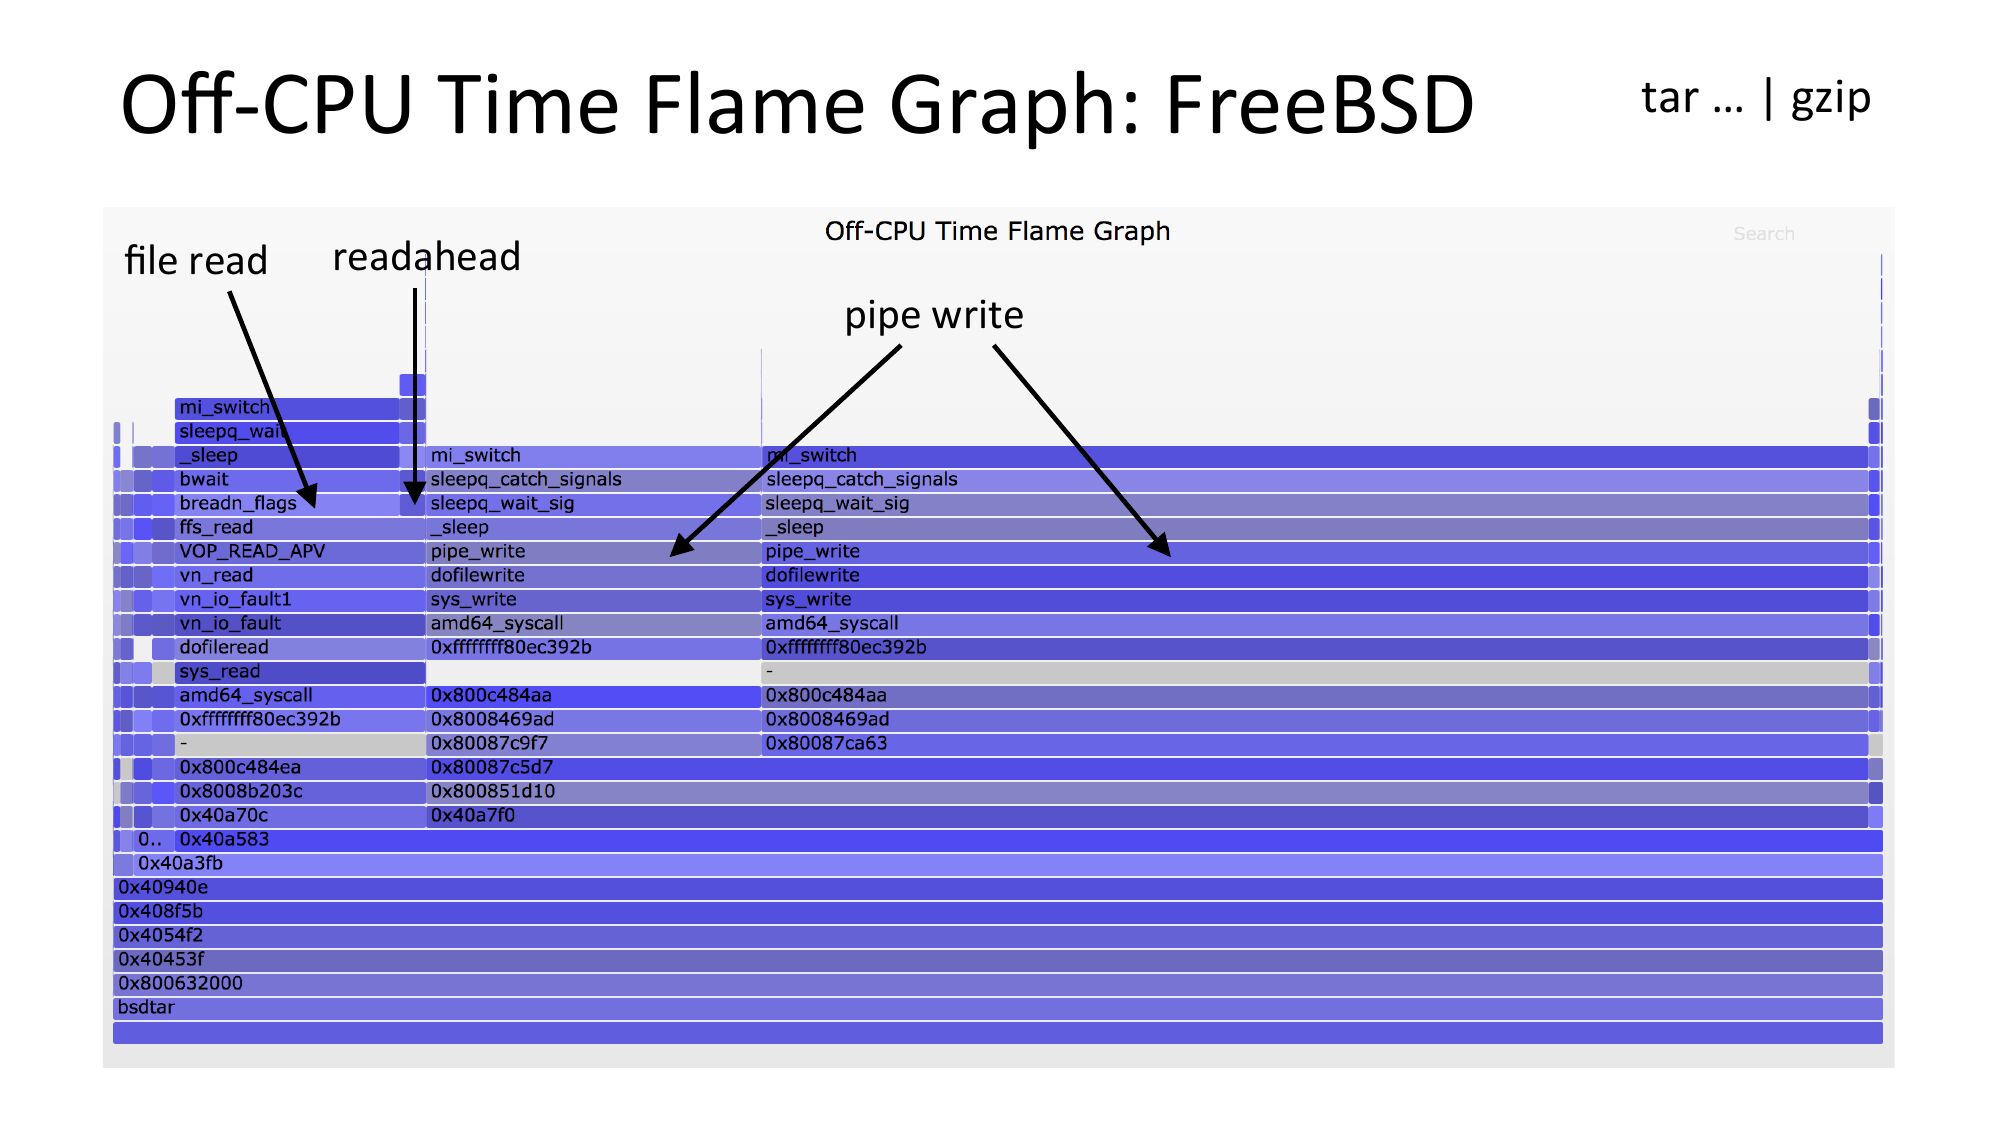
slide 43:Off-CPU Time Flame Graph: FreeBSD file read readahead pipe write tar … | gzipslide 44:
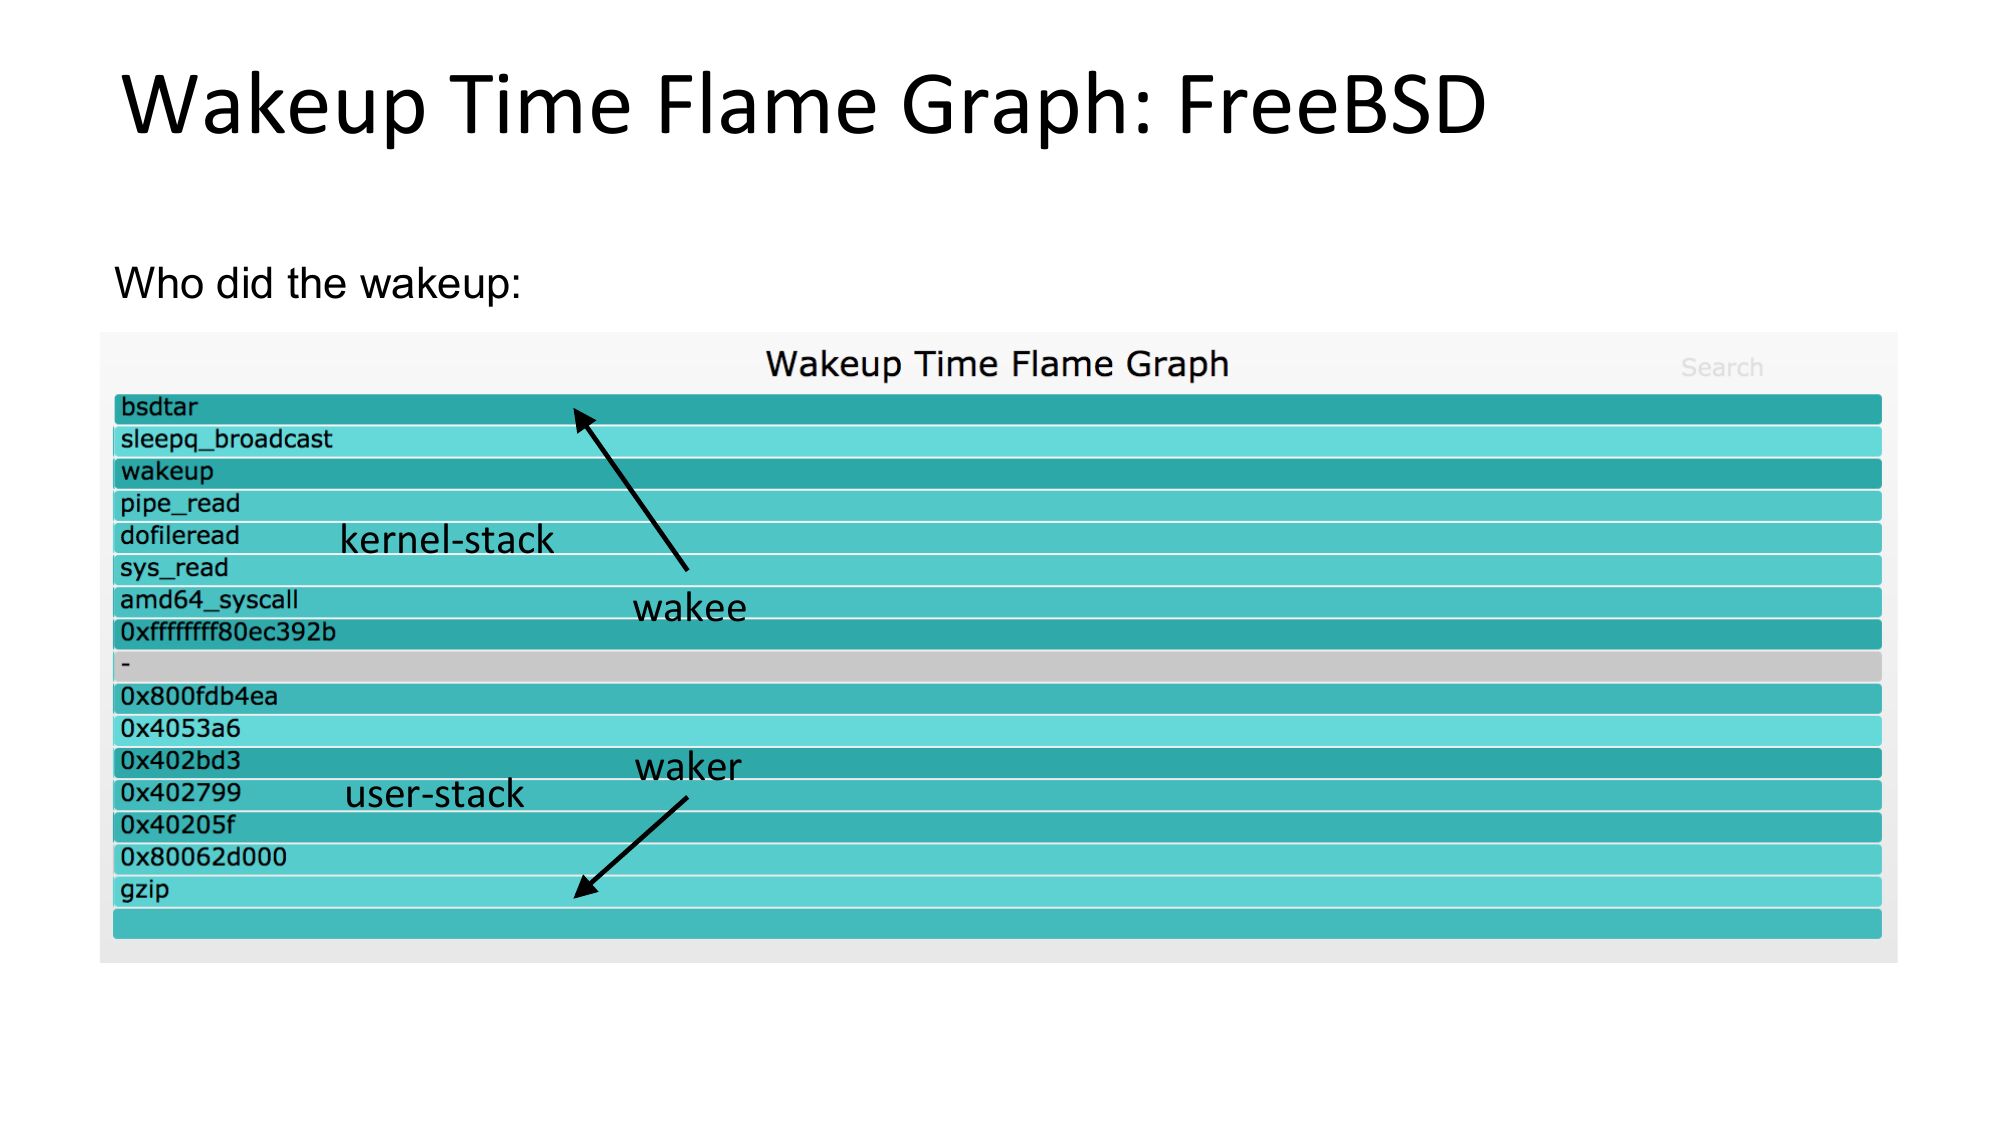
Wakeup Time Flame Graph: FreeBSD
Who did the wakeup:
kernel-stack
wakee
user-stack
waker
slide 45:
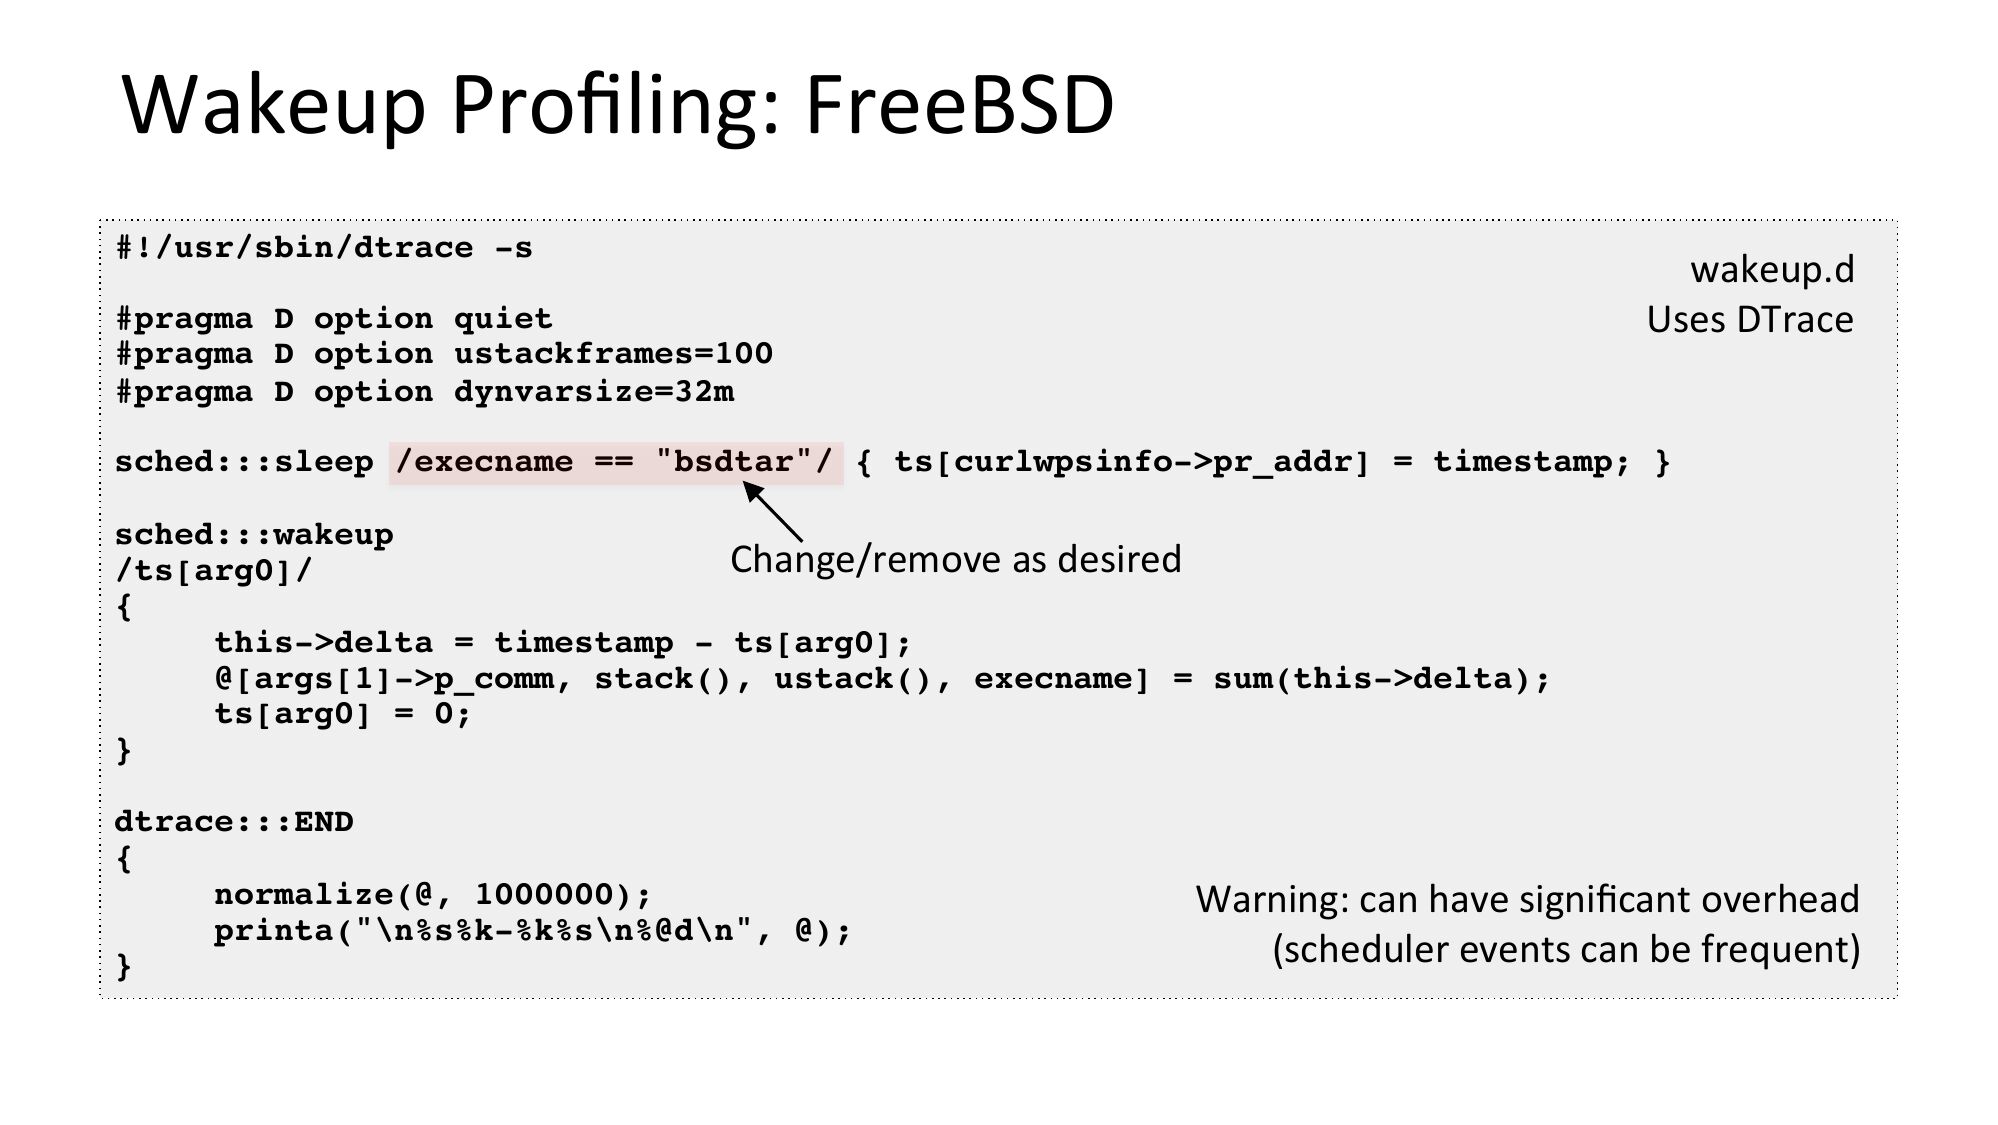
Wakeup Profiling: FreeBSD
#!/usr/sbin/dtrace -s
wakeup.d
Uses DTrace
#pragma D option quiet
#pragma D option ustackframes=100
#pragma D option dynvarsize=32m
sched:::sleep /execname == "bsdtar"/ { ts[curlwpsinfo->gt;pr_addr] = timestamp; }
sched:::wakeup
Change/remove as desired
/ts[arg0]/
this->gt;delta = timestamp - ts[arg0];
@[args[1]->gt;p_comm, stack(), ustack(), execname] = sum(this->gt;delta);
ts[arg0] = 0;
dtrace:::END
normalize(@, 1000000);
printa("\n%s%k-%k%s\n%@d\n", @);
Warning: can have significant overhead
(scheduler events can be frequent)
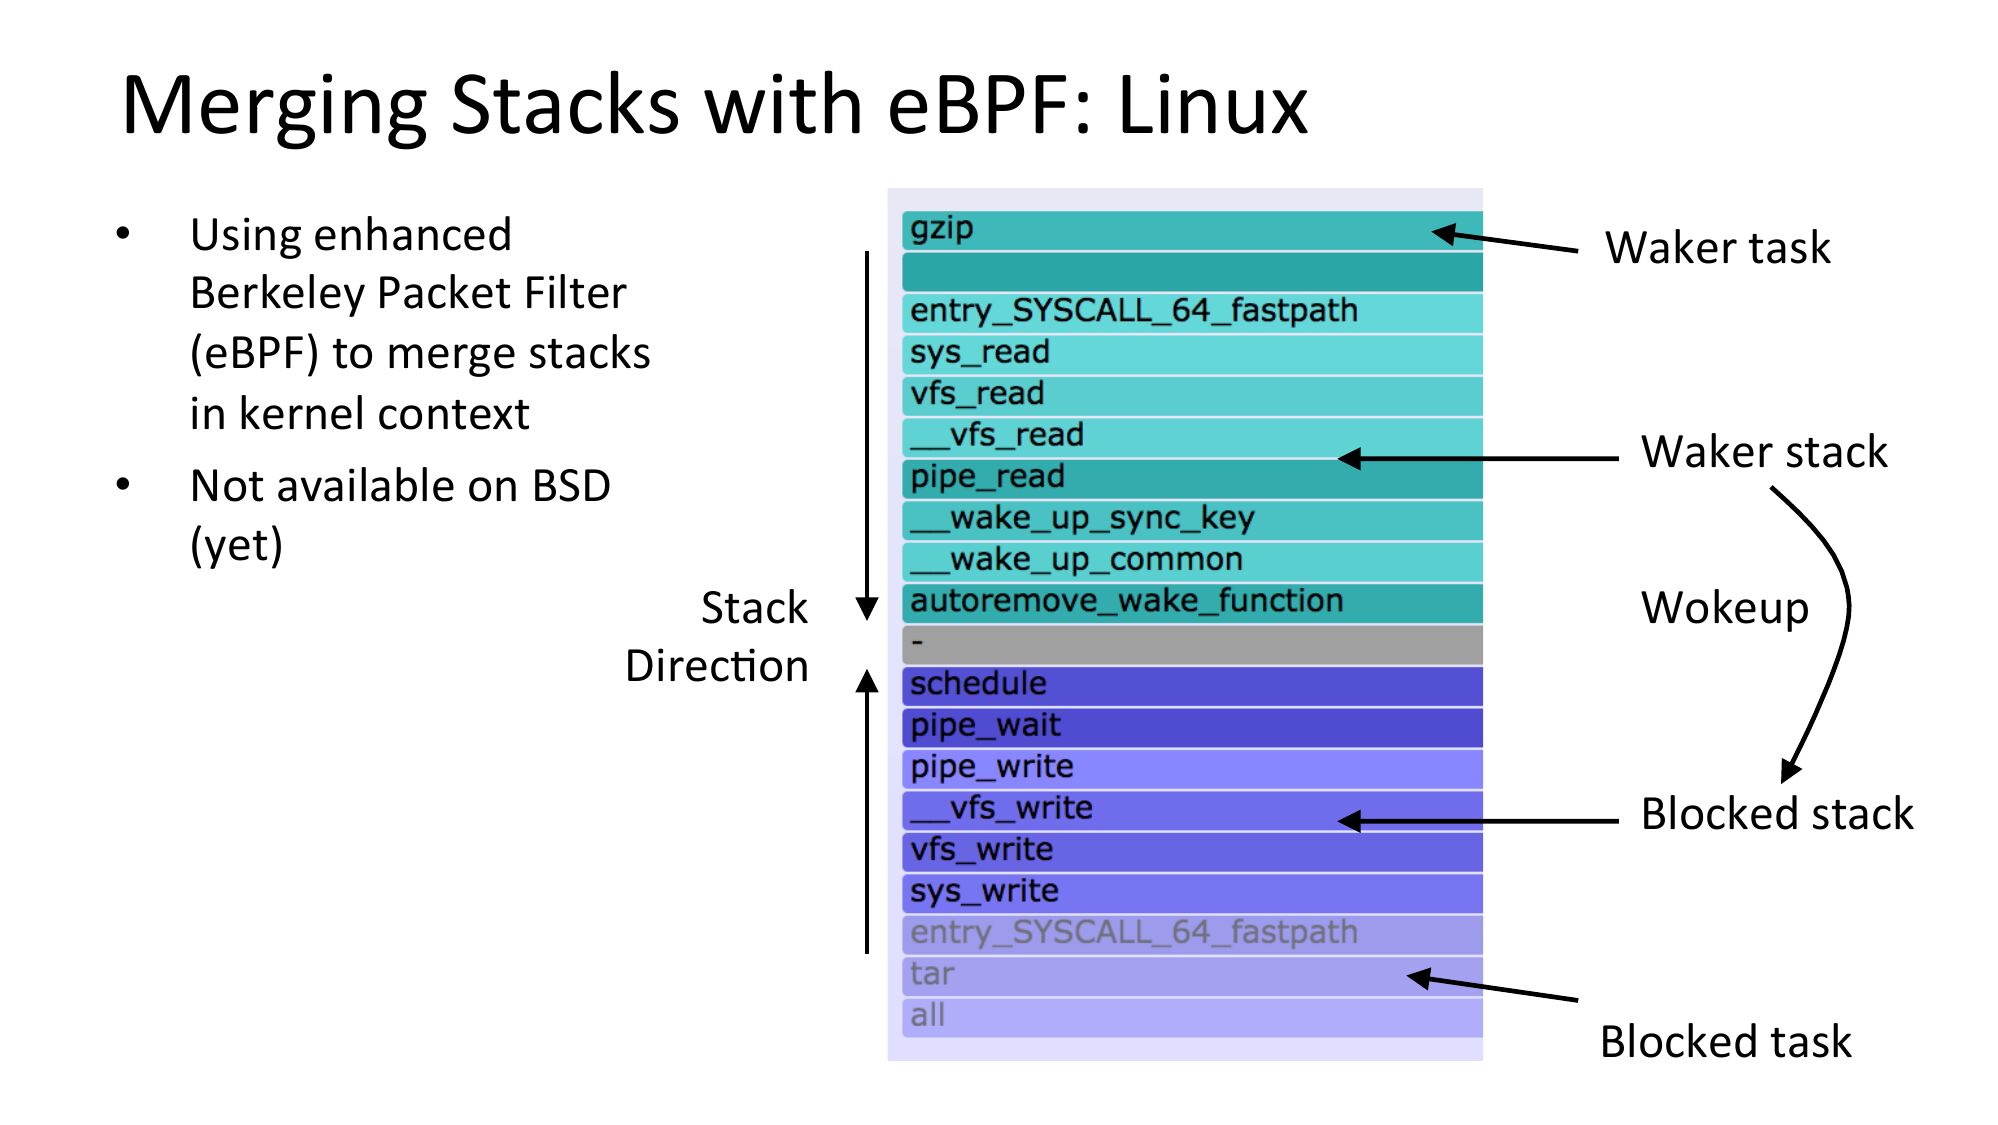
slide 46:Merging Stacks with eBPF: Linux Using enhanced Berkeley Packet Filter (eBPF) to merge stacks in kernel context Not available on BSD (yet) Stack DirecNon Waker task Waker stack Wokeup Blocked stack Blocked taskslide 47:
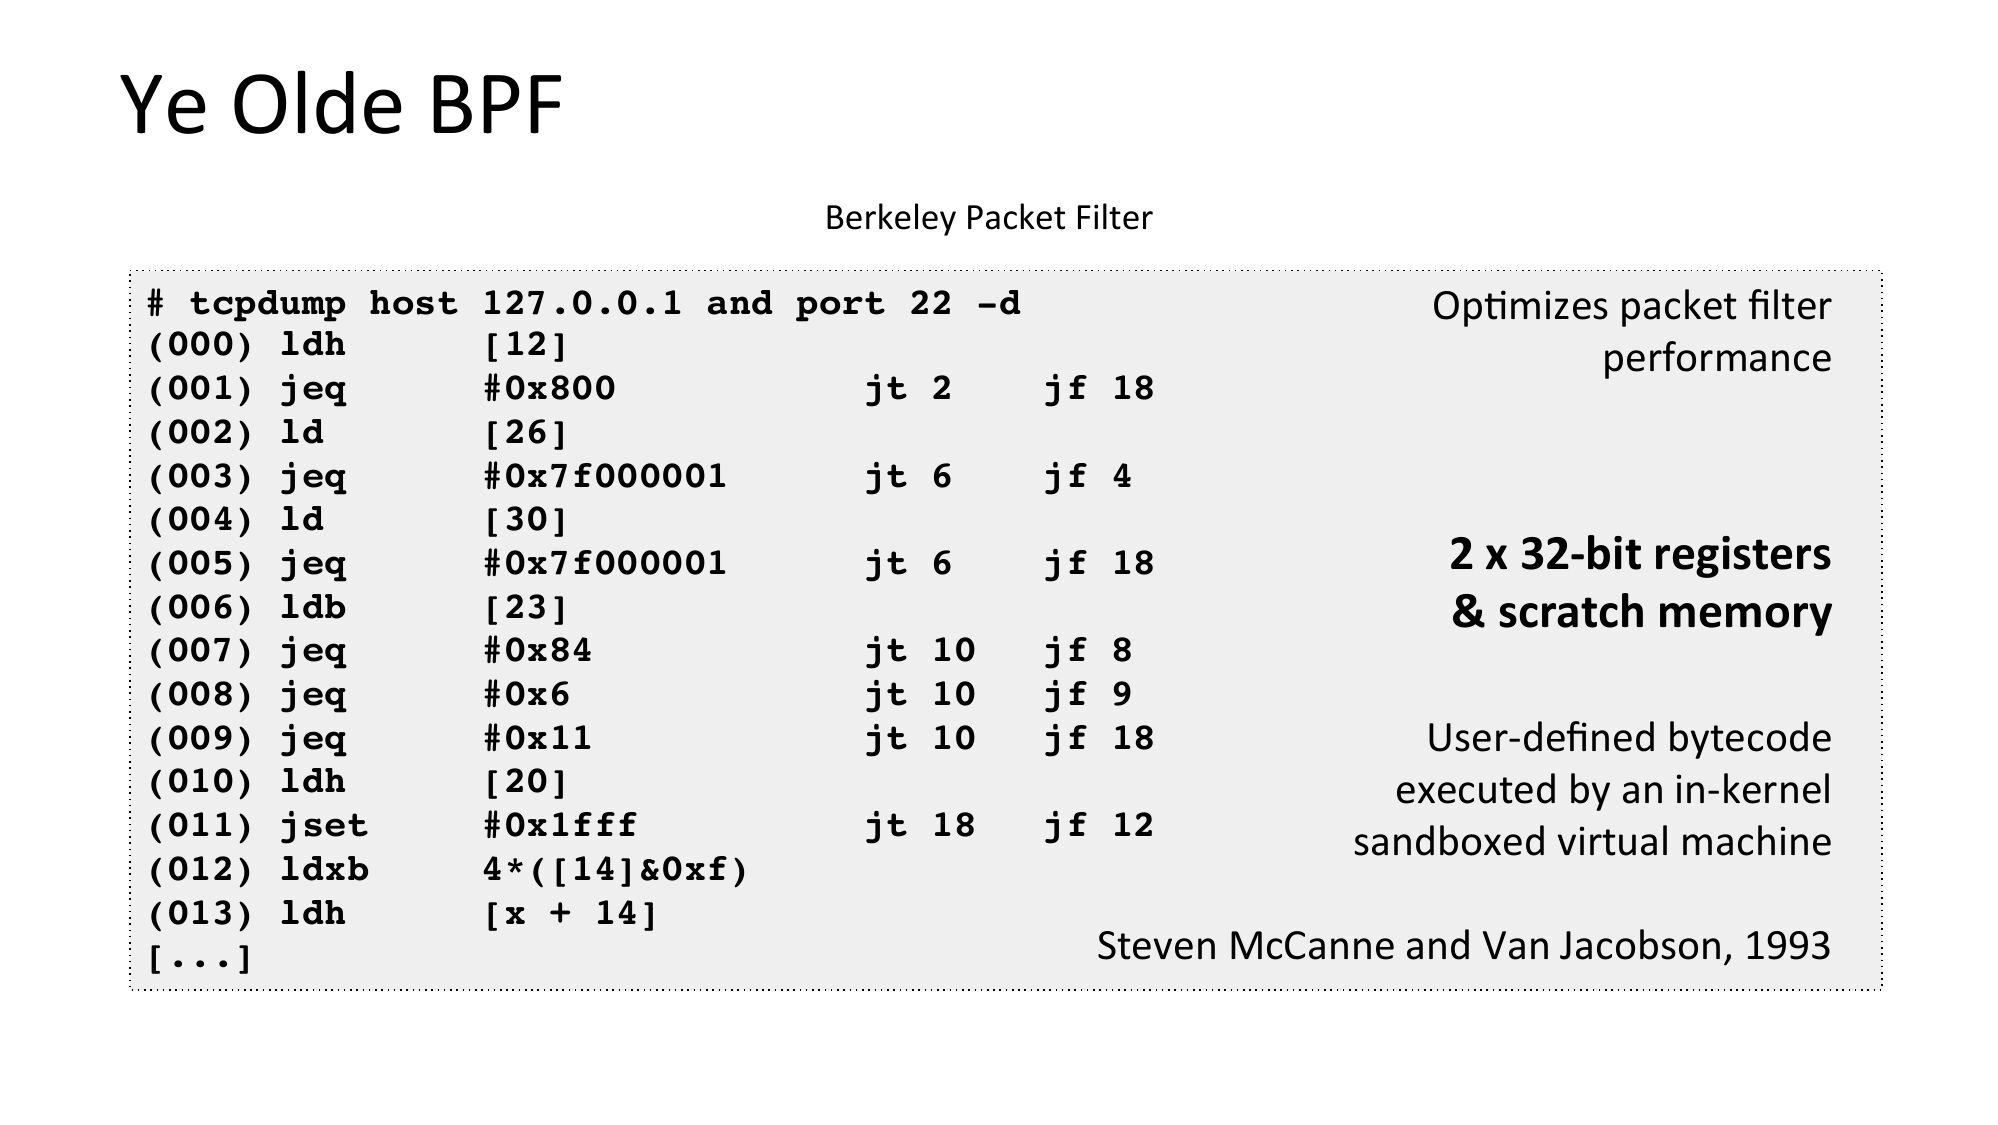
Ye Olde BPF
Berkeley Packet Filter
# tcpdump host 127.0.0.1 and port 22 -d
OpNmizes packet filter
(000) ldh
[12]
performance
(001) jeq
#0x800
jt 2
jf 18
(002) ld
[26]
(003) jeq
#0x7f000001
jt 6
jf 4
(004) ld
[30]
2 x 32-bit registers
(005) jeq
#0x7f000001
jt 6
jf 18
(006) ldb
[23]
& scratch memory
(007) jeq
#0x84
jt 10
jf 8
(008) jeq
#0x6
jt 10
jf 9
(009) jeq
#0x11
jt 10
jf 18
User-defined bytecode
(010) ldh
[20]
executed by an in-kernel
(011) jset
#0x1fff
jt 18
jf 12
sandboxed virtual machine
(012) ldxb
4*([14]&0xf)
(013) ldh
[x + 14]
Steven McCanne and Van Jacobson, 1993
[...]
slide 48:
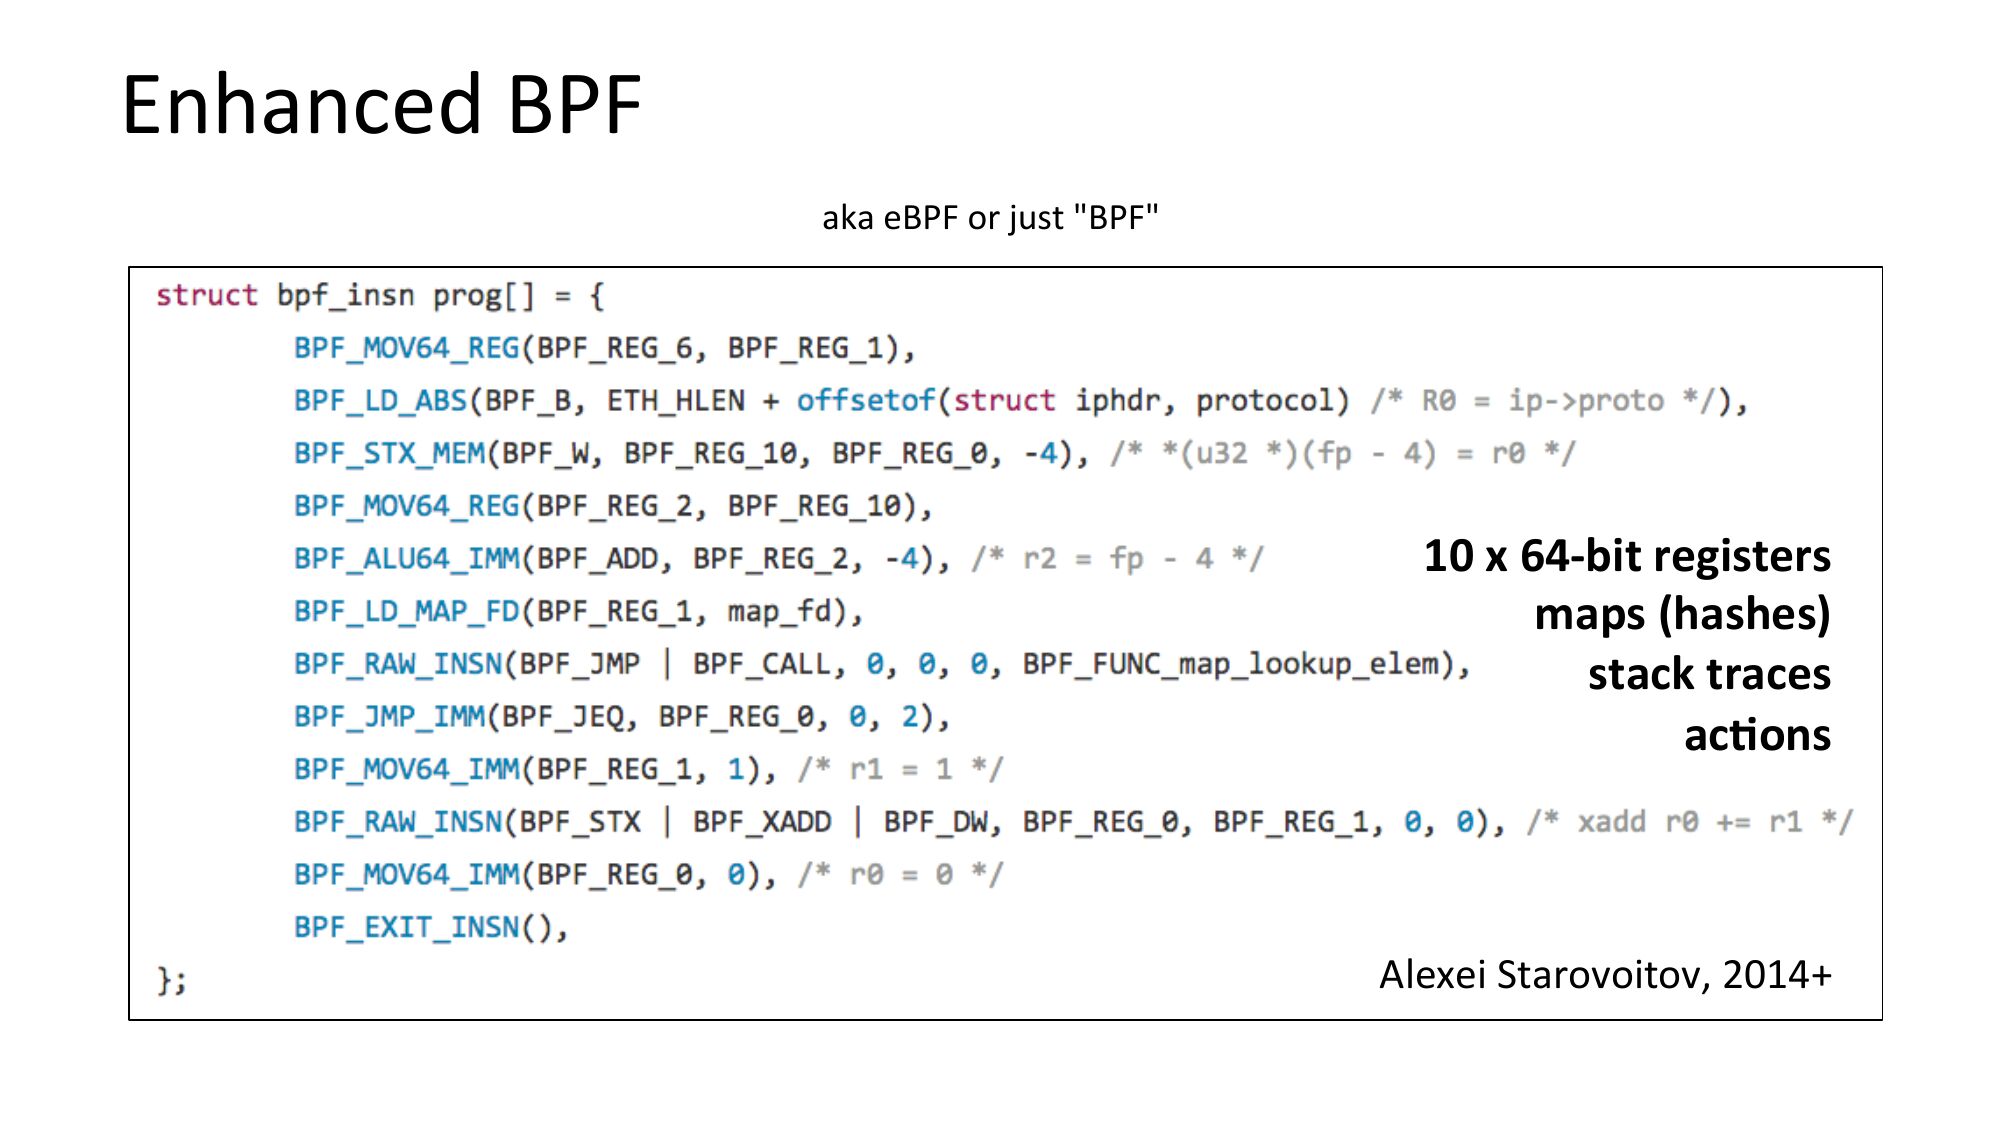
Enhanced BPF
aka eBPF or just "BPF"
10 x 64-bit registers
maps (hashes)
stack traces
ac=ons
Alexei Starovoitov, 2014+
slide 49:
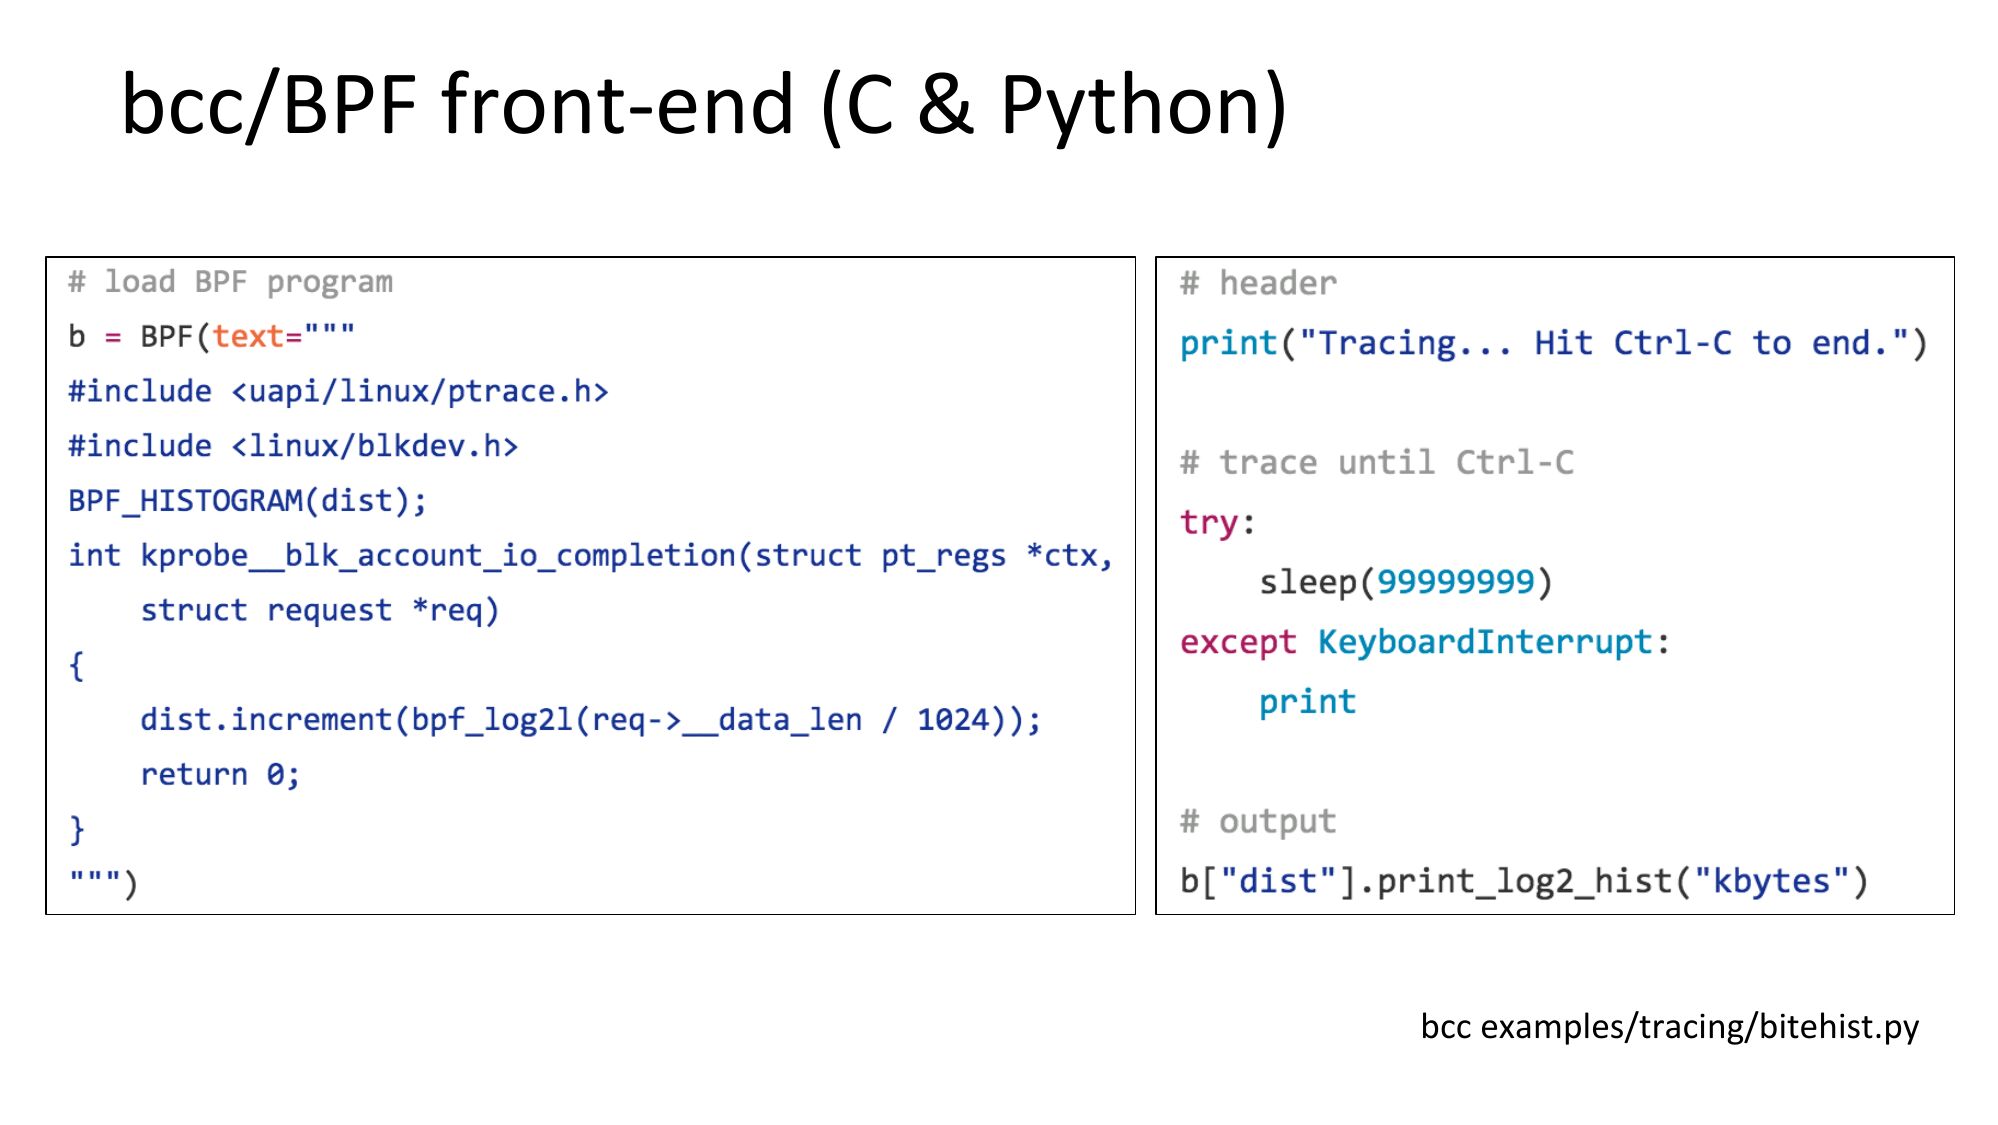
bcc/BPF front-end (C & Python)
bcc examples/tracing/bitehist.py
slide 50:
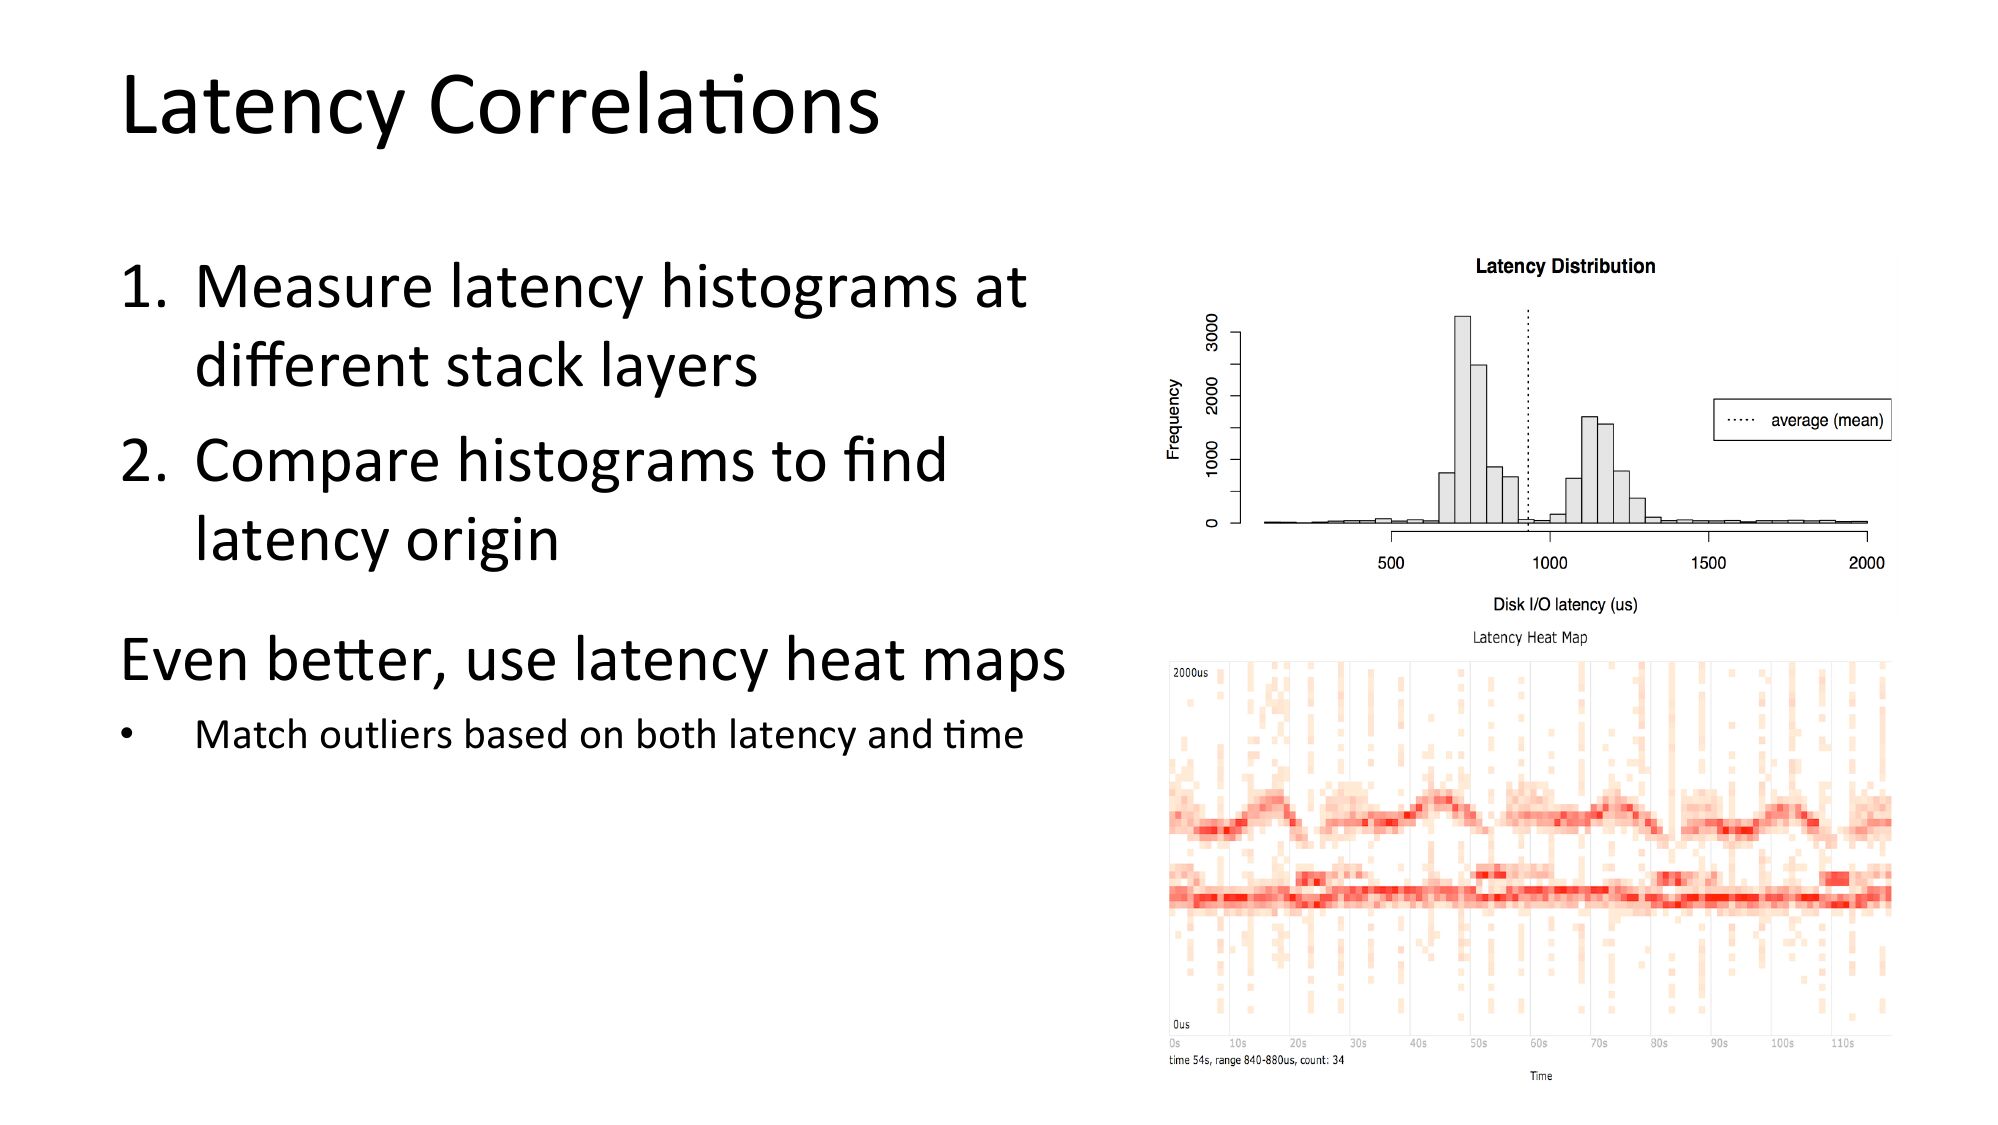
Latency CorrelaNons
1. Measure latency histograms at
different stack layers
2. Compare histograms to find
latency origin
Even bejer, use latency heat maps
Match outliers based on both latency and Nme
slide 51:
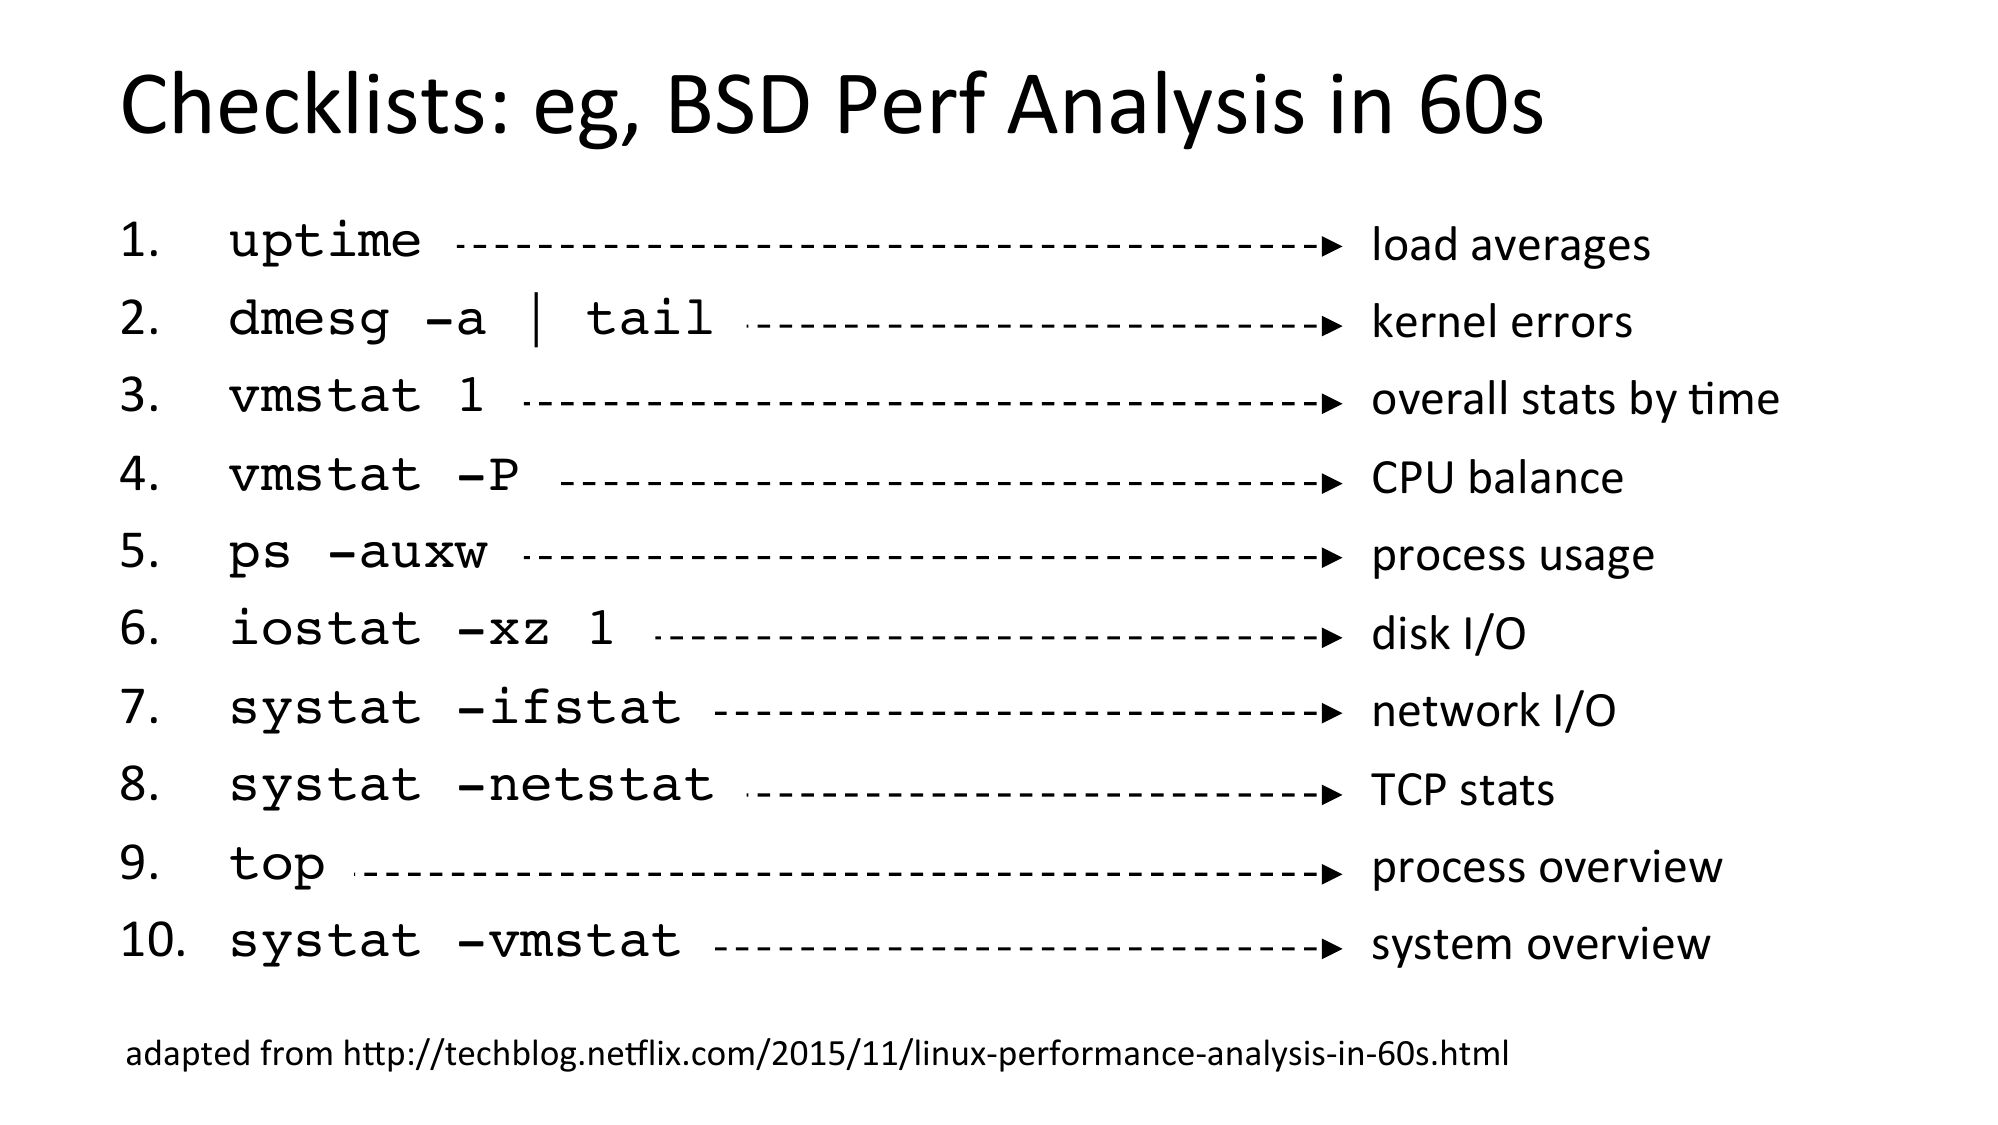
Checklists: eg, BSD Perf Analysis in 60s
uptime
dmesg -a | tail
vmstat 1
vmstat -P
ps -auxw
iostat -xz 1
systat -ifstat
systat -netstat
top
systat -vmstat
load averages
kernel errors
overall stats by Nme
CPU balance
process usage
disk I/O
network I/O
TCP stats
process overview
system overview
adapted from hjp://techblog.neylix.com/2015/11/linux-performance-analysis-in-60s.html
slide 52:
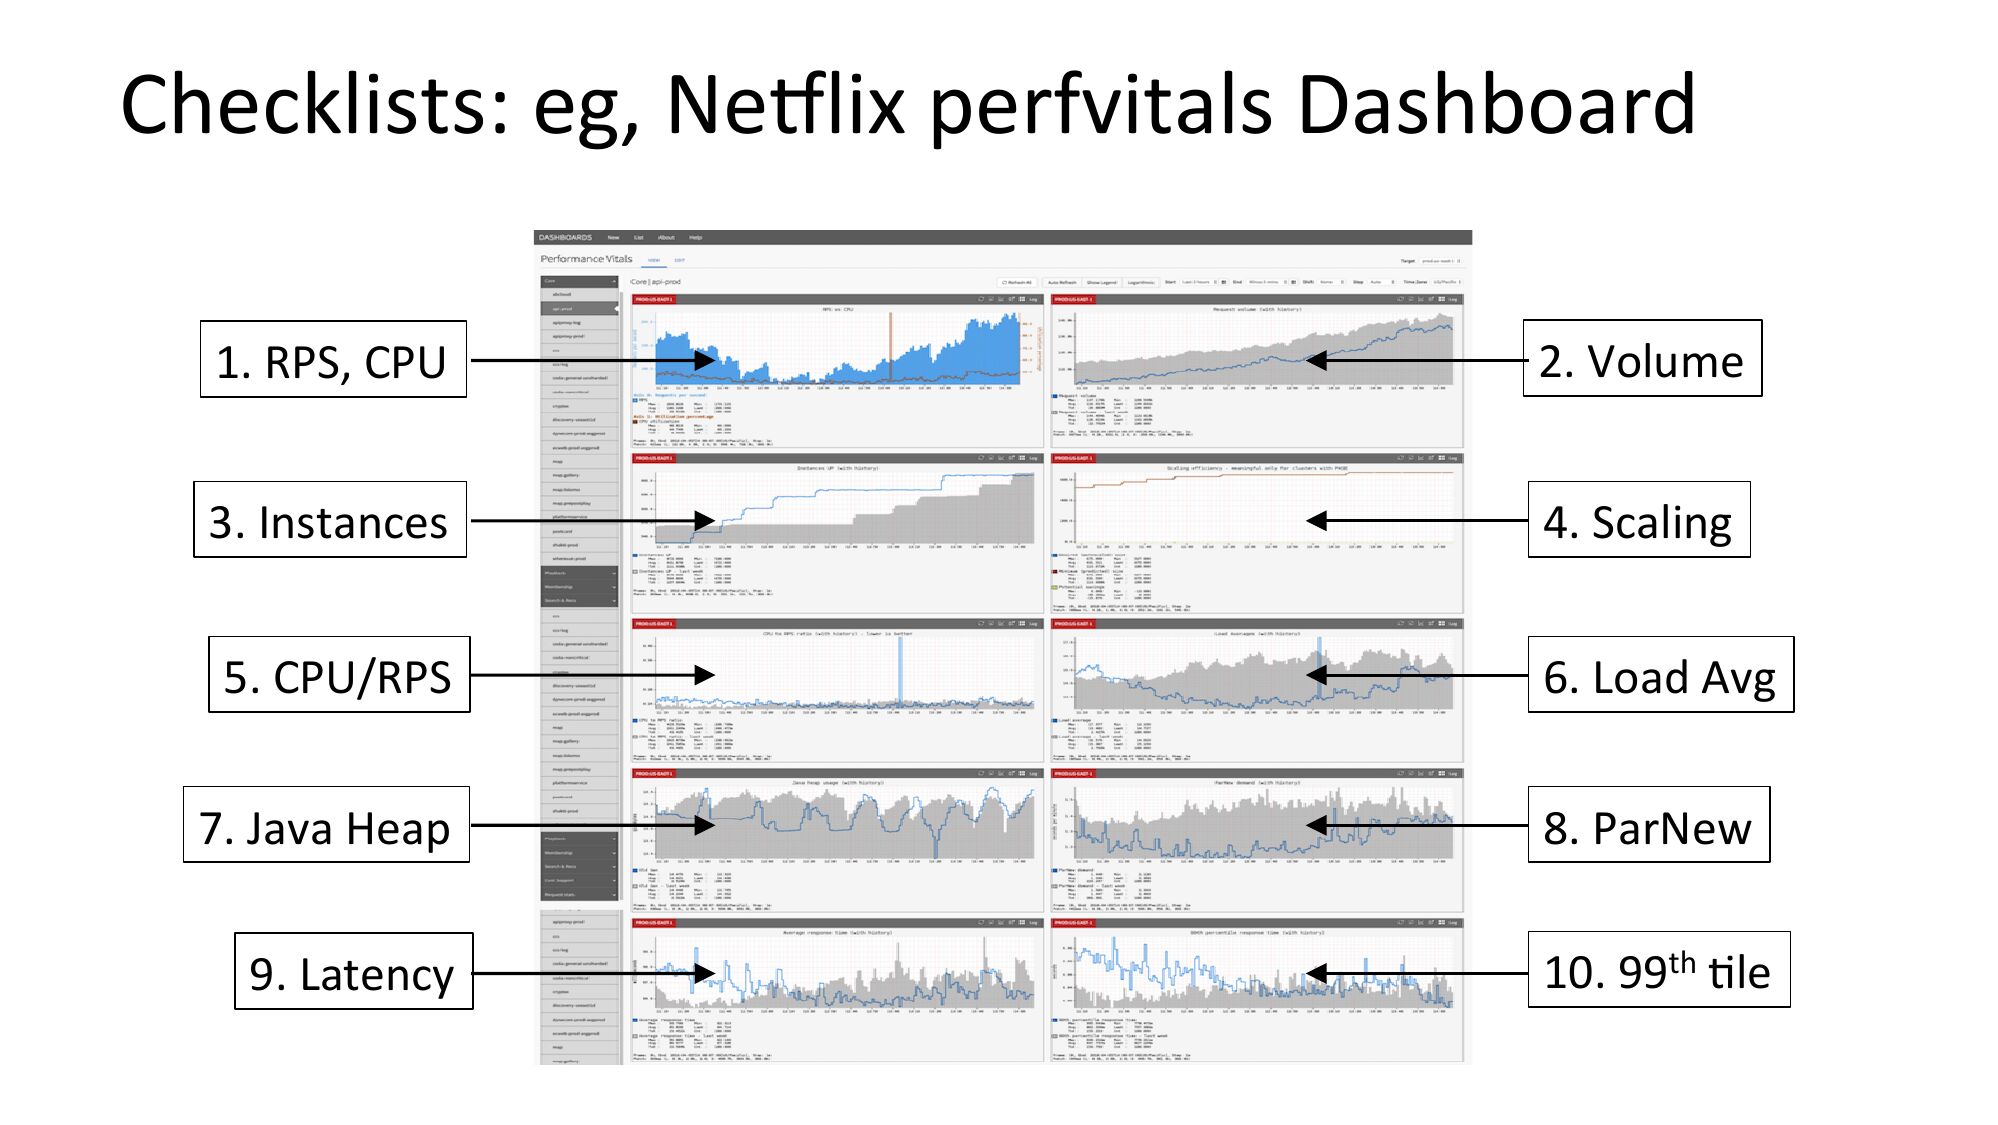
Checklists: eg, Neylix perfvitals Dashboard
1. RPS, CPU
2. Volume
3. Instances
4. Scaling
5. CPU/RPS
6. Load Avg
7. Java Heap
8. ParNew
9. Latency
10. 99th Nle
slide 53:
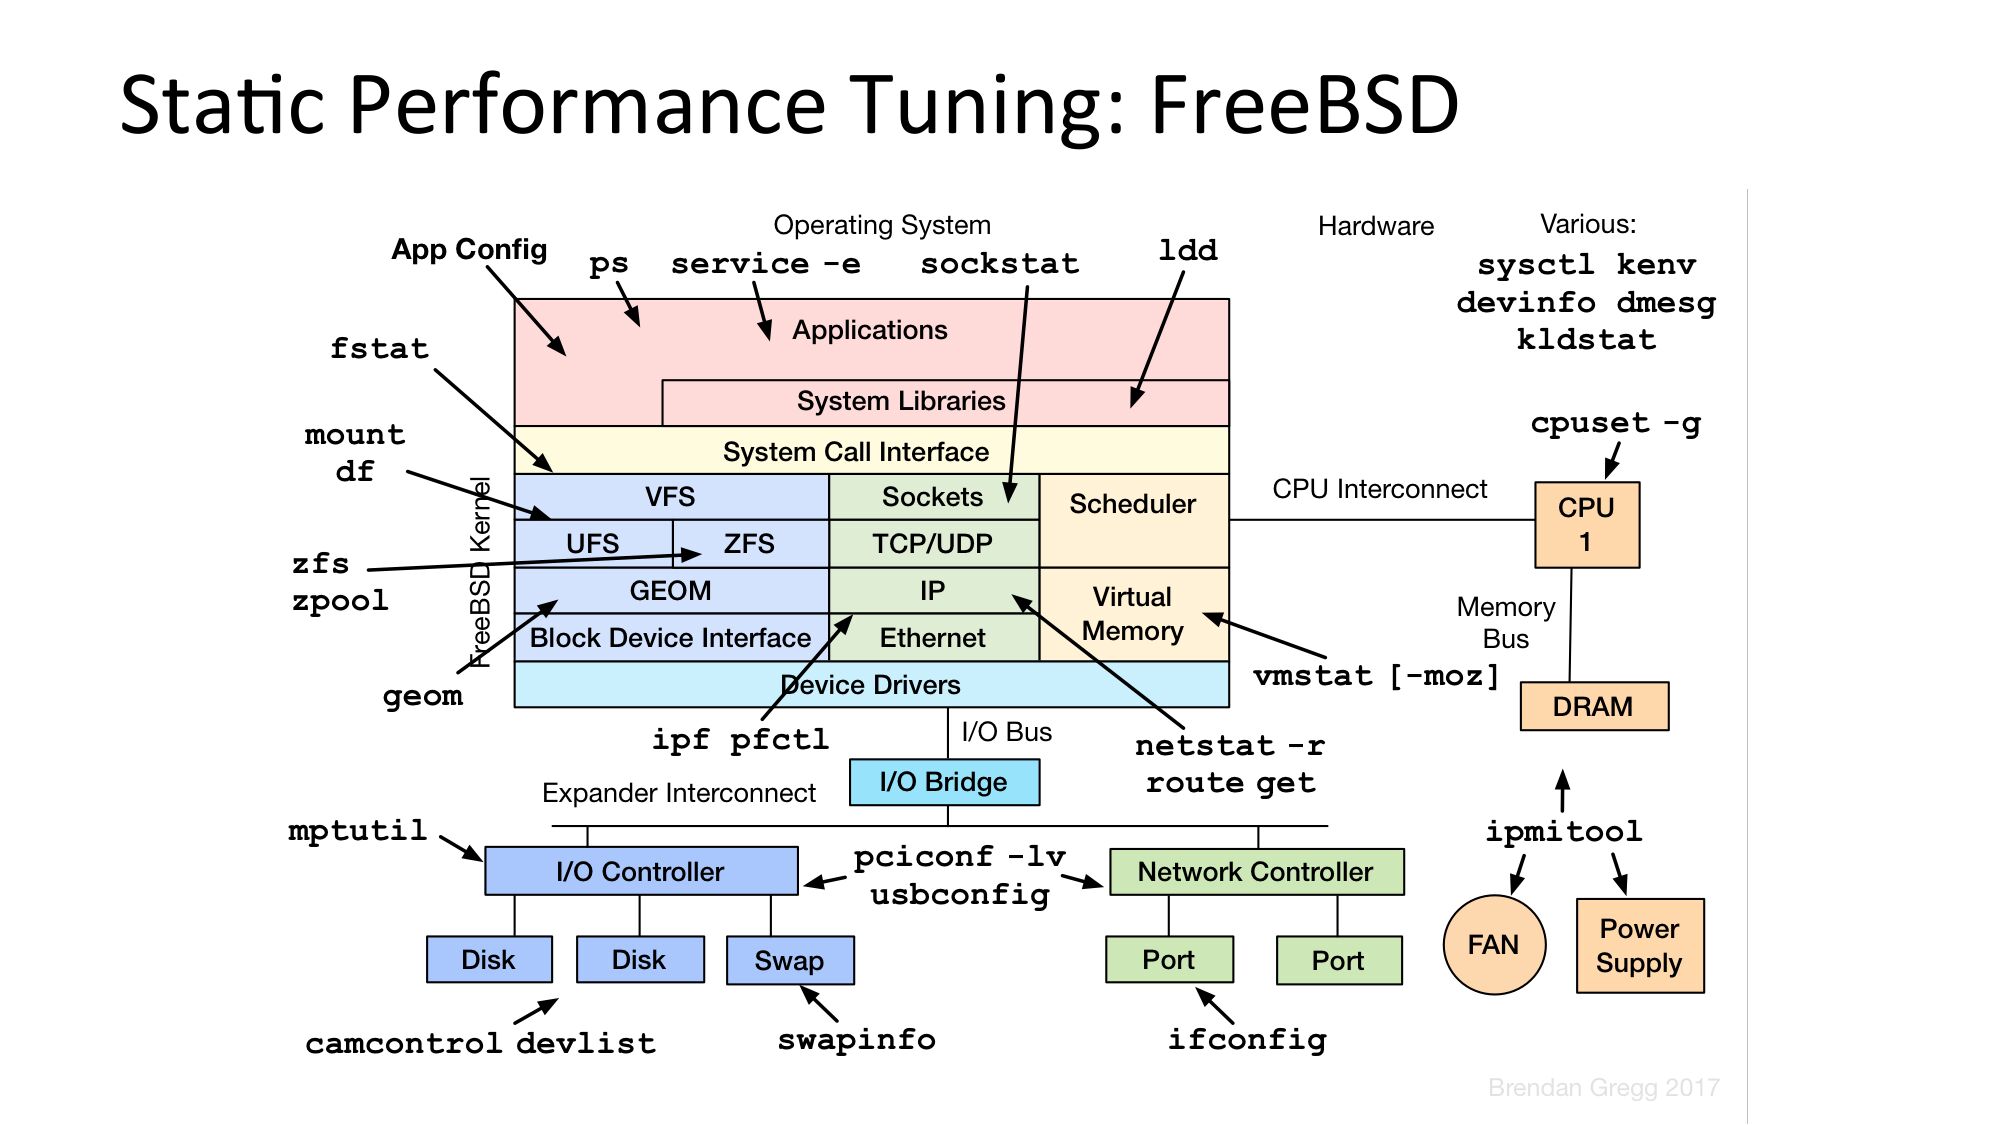
StaNc Performance Tuning: FreeBSDslide 54:
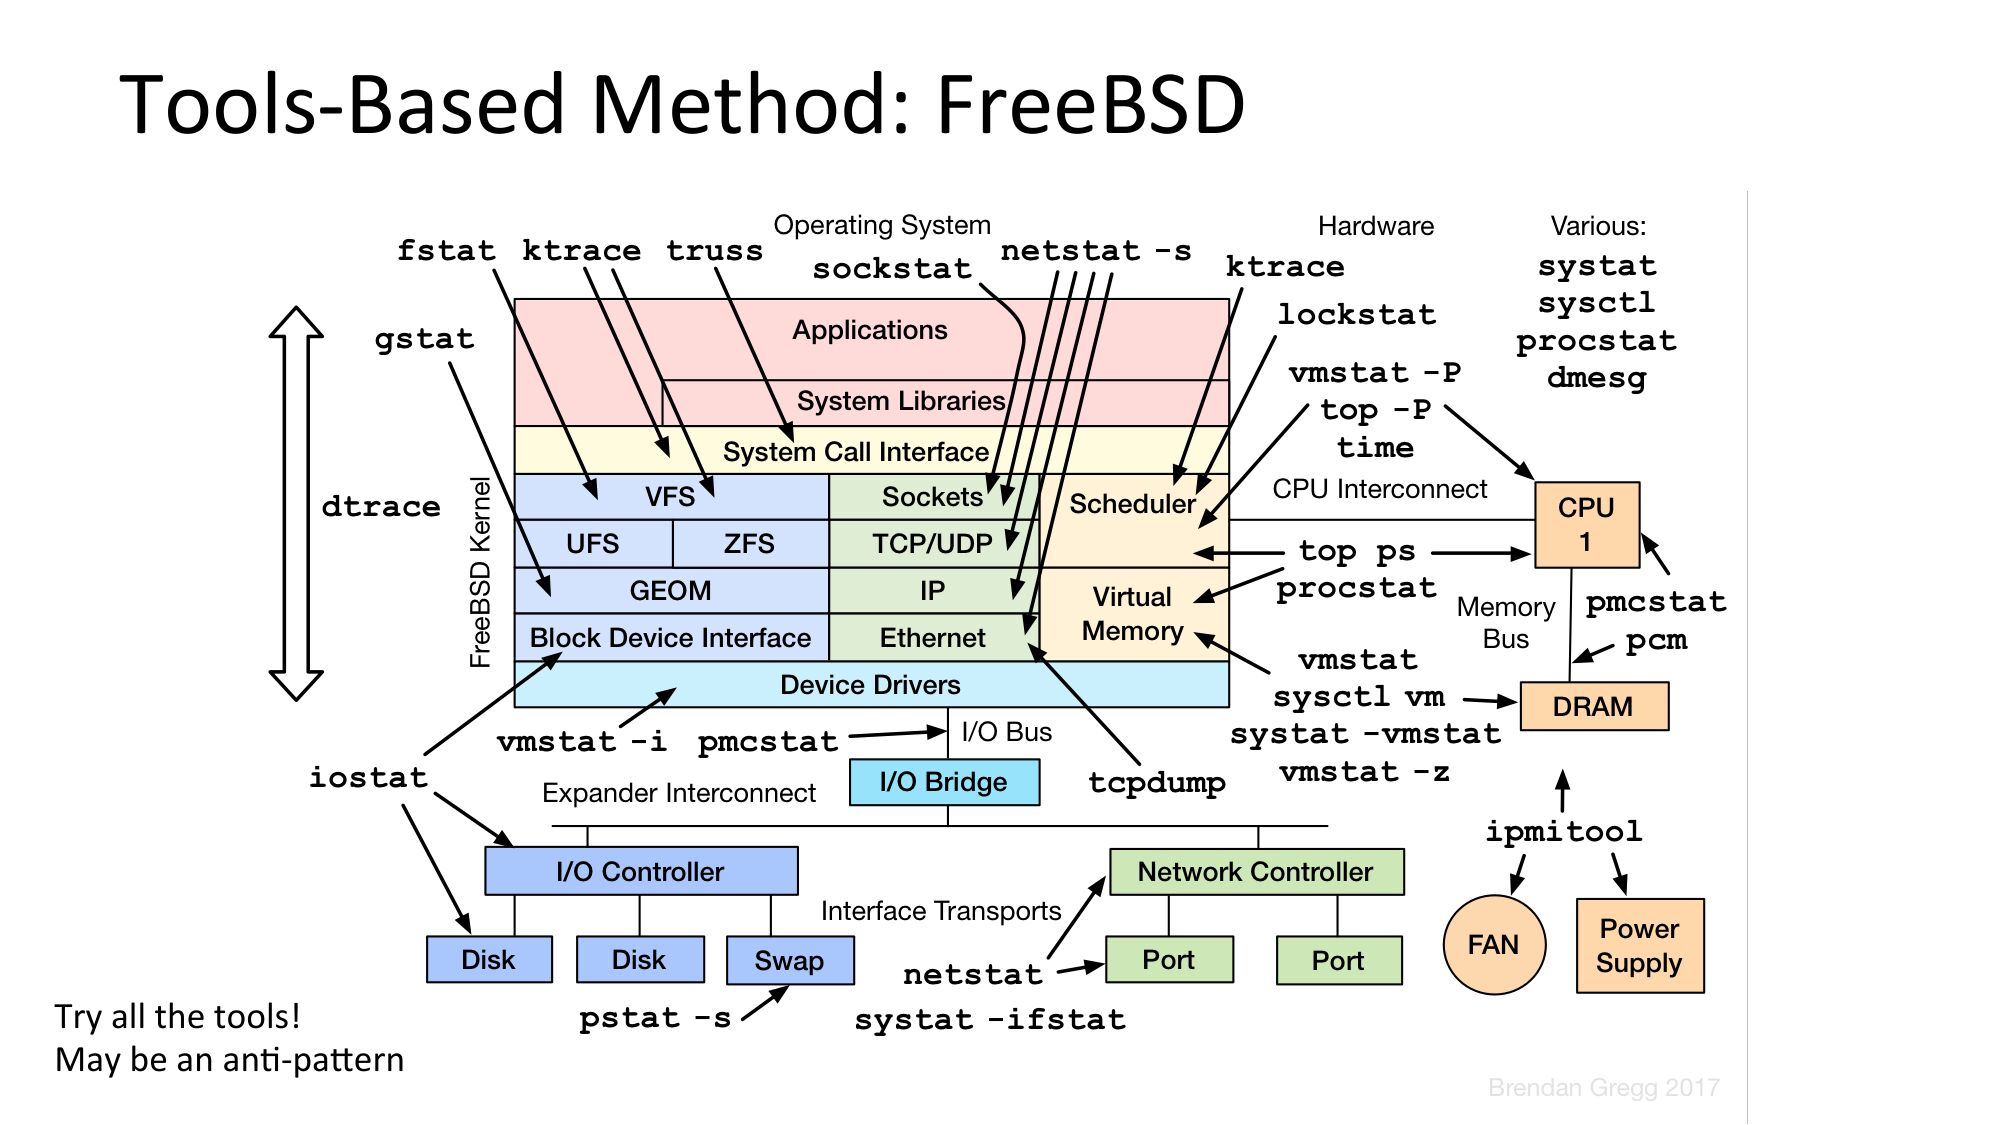
Tools-Based Method: FreeBSD
Try all the tools!
May be an anN-pajern
slide 55:
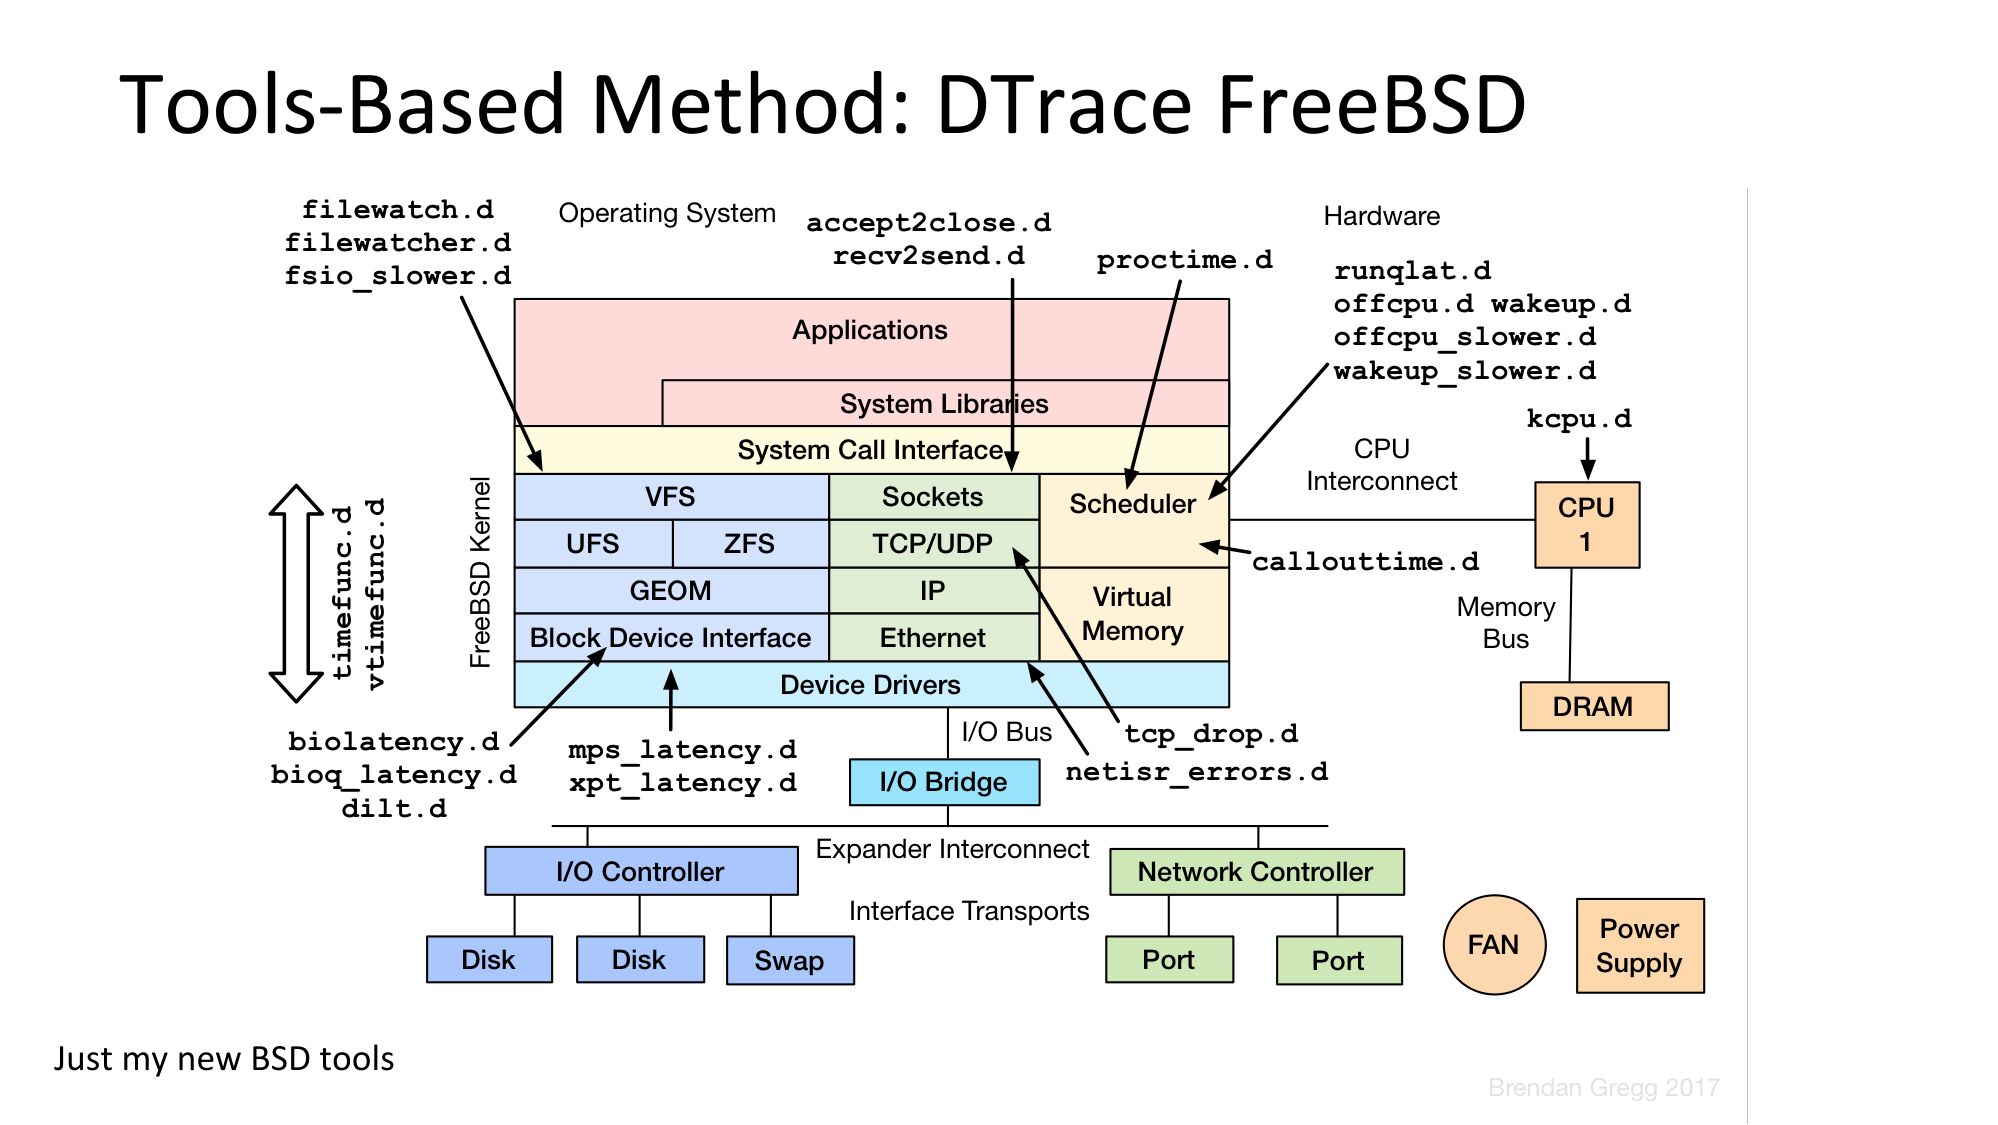
Tools-Based Method: DTrace FreeBSD
Just my new BSD tools
slide 56:
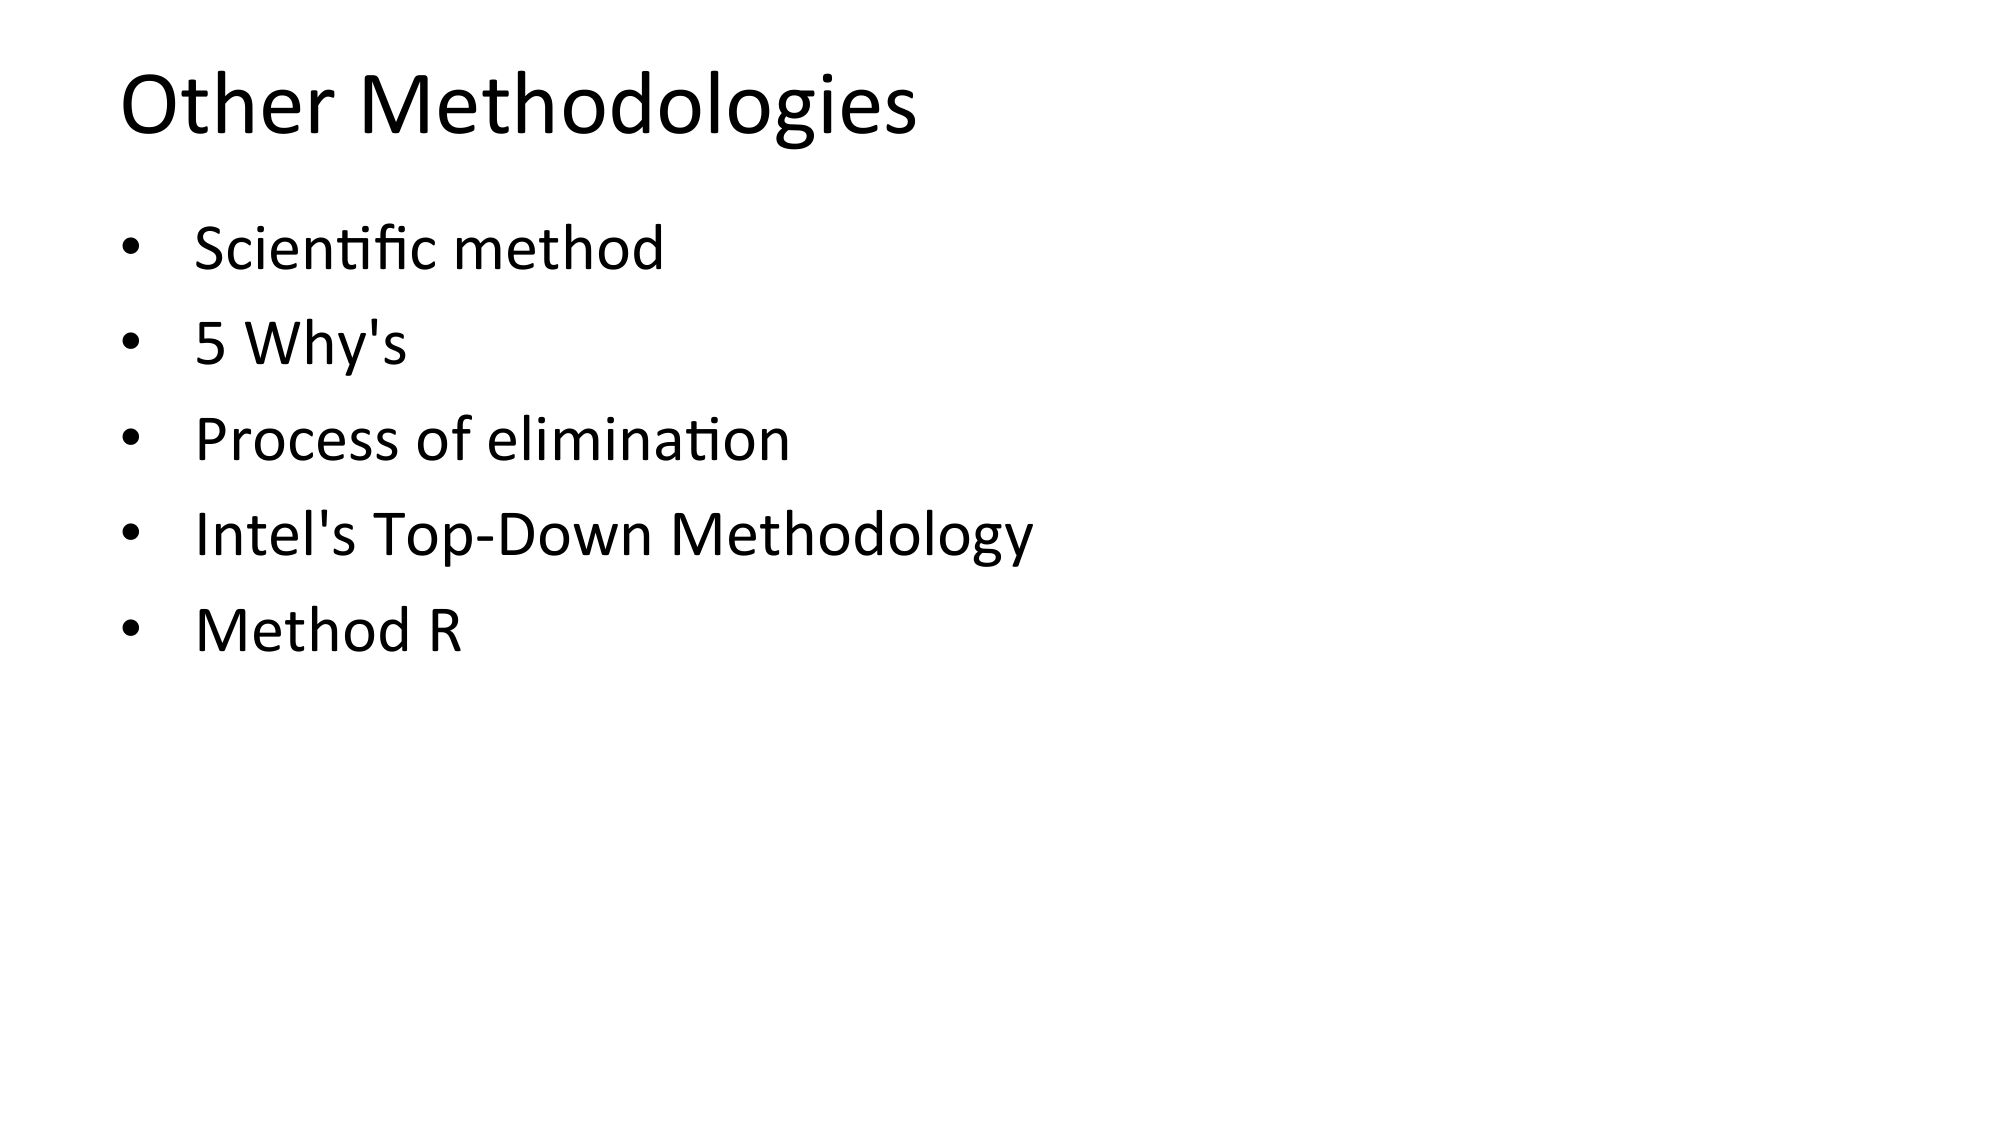
Other Methodologies
ScienNfic method
5 Why's
Process of eliminaNon
Intel's Top-Down Methodology
Method R
slide 57:
What You Can Doslide 58:
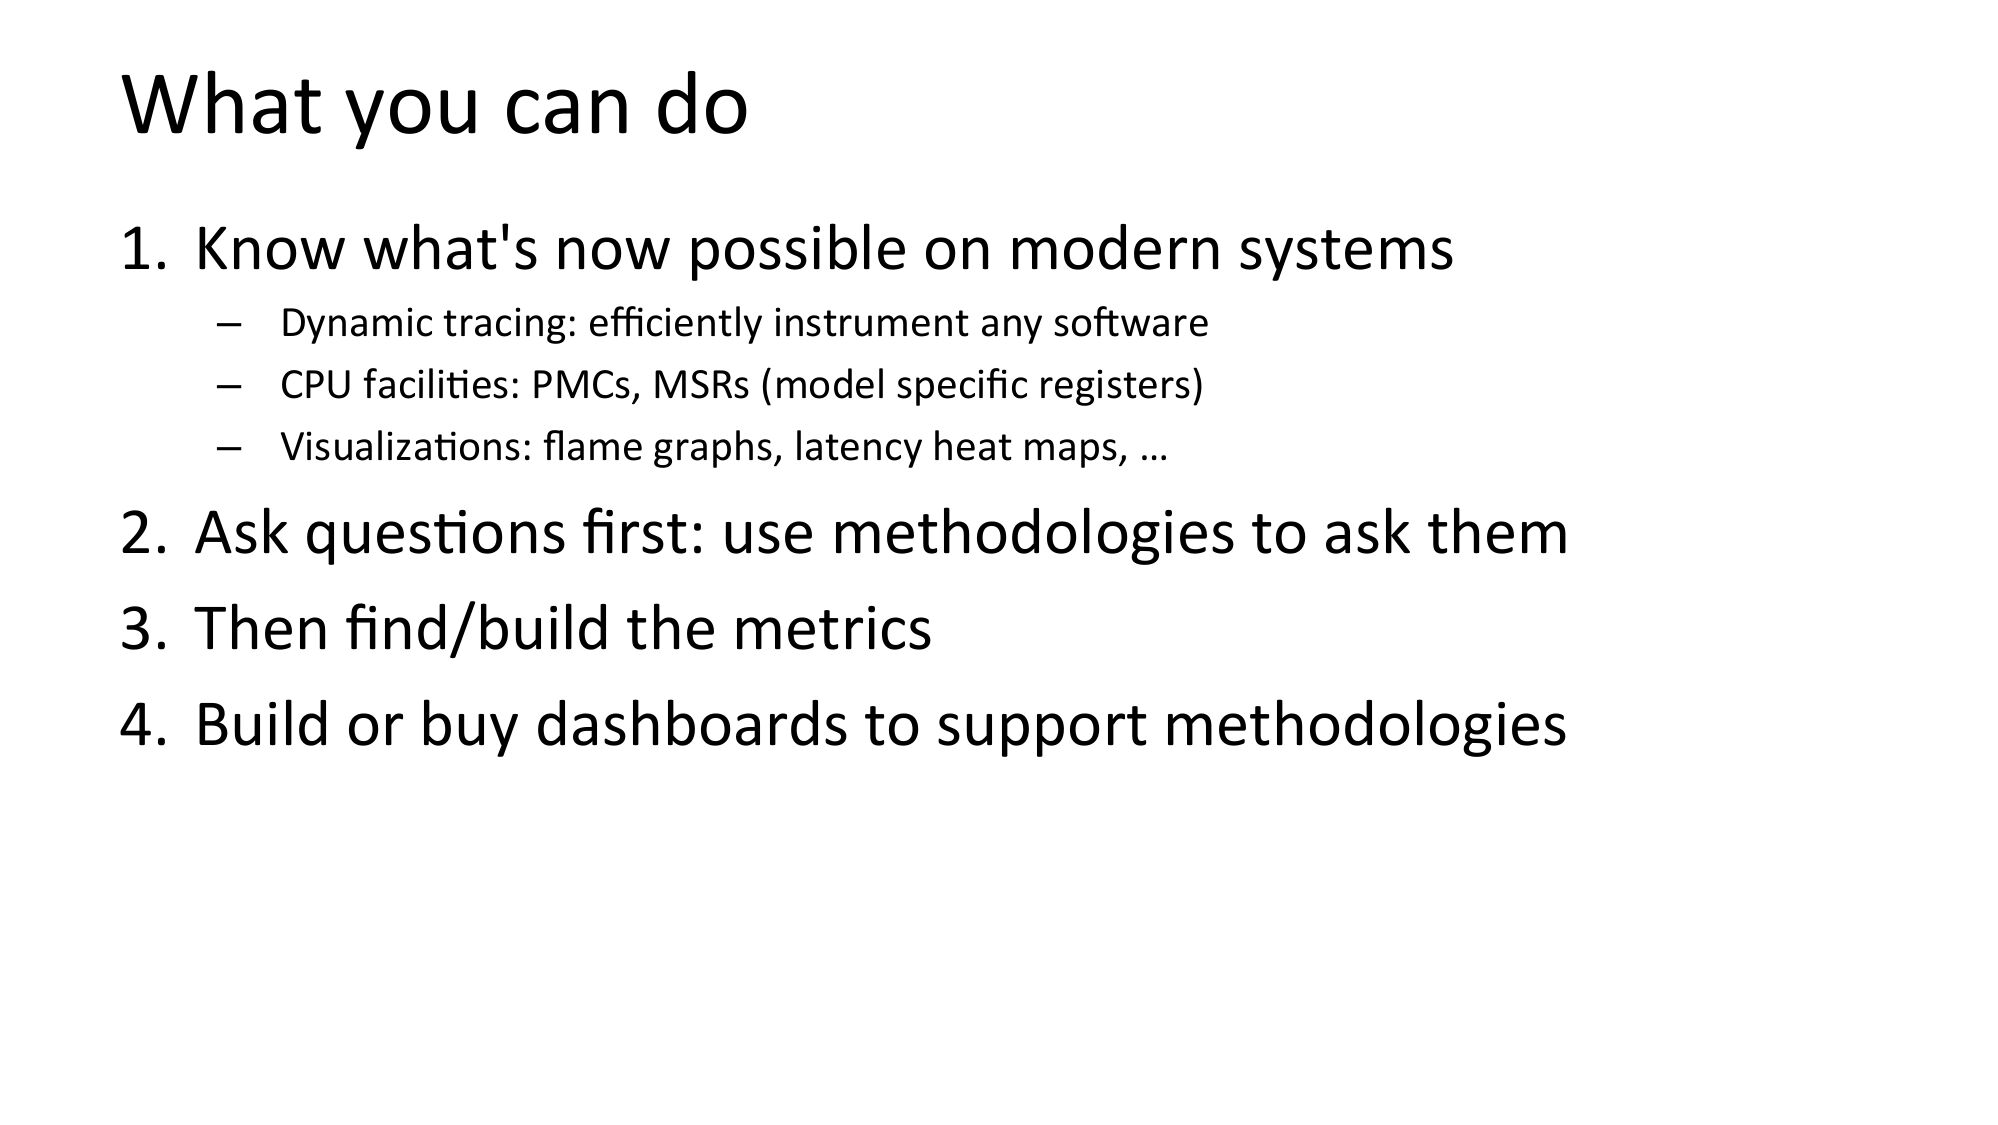
What you can do
1. Know what's now possible on modern systems
– Dynamic tracing: efficiently instrument any soRware
– CPU faciliNes: PMCs, MSRs (model specific registers)
– VisualizaNons: flame graphs, latency heat maps, …
2. Ask quesNons first: use methodologies to ask them
3. Then find/build the metrics
4. Build or buy dashboards to support methodologies
slide 59:
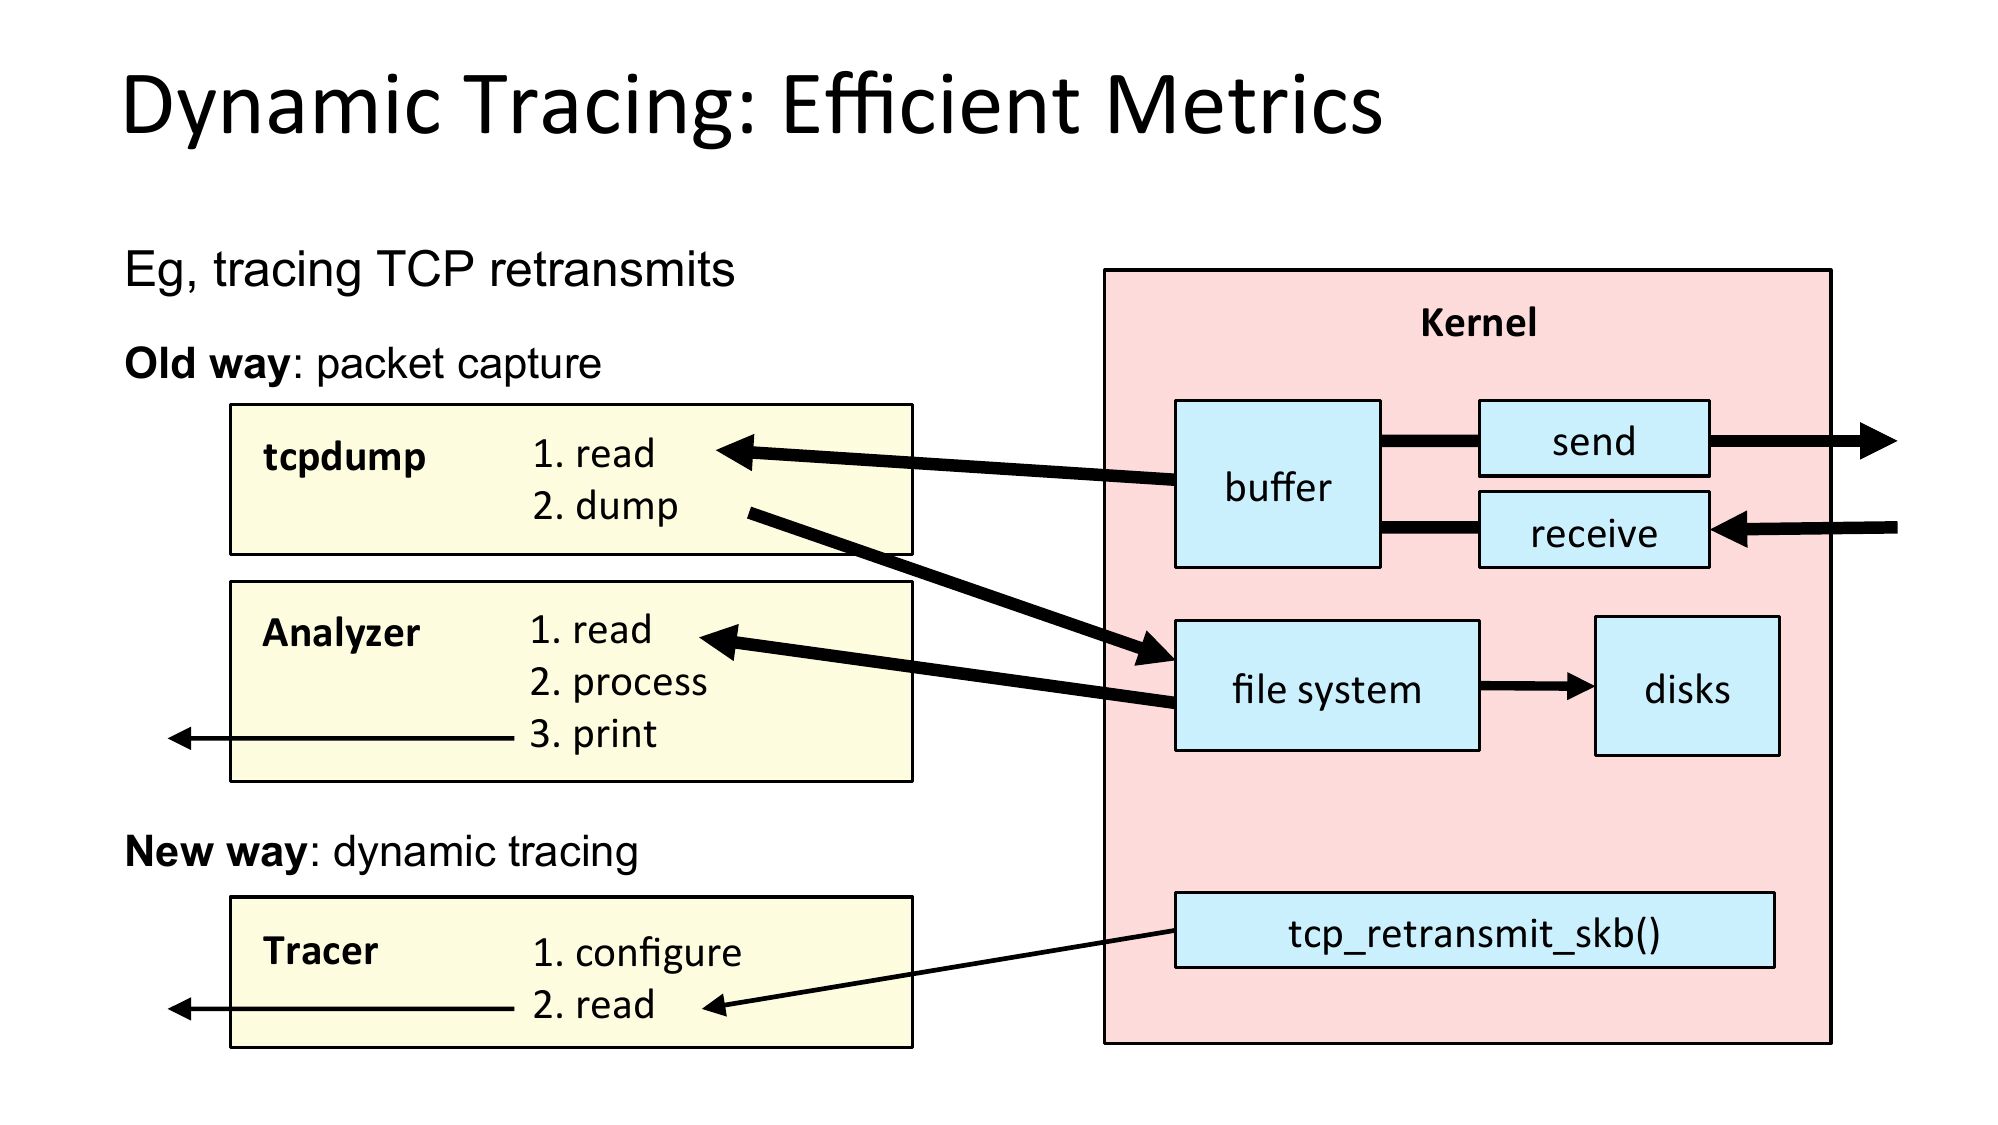
Dynamic Tracing: Efficient Metrics
Eg, tracing TCP retransmits
Kernel
Old way: packet capture
tcpdump
Analyzer
1. read
2. dump
buffer
1. read
2. process
3. print
file system
send
receive
disks
New way: dynamic tracing
Tracer
1. configure
2. read
tcp_retransmit_skb()
slide 60:
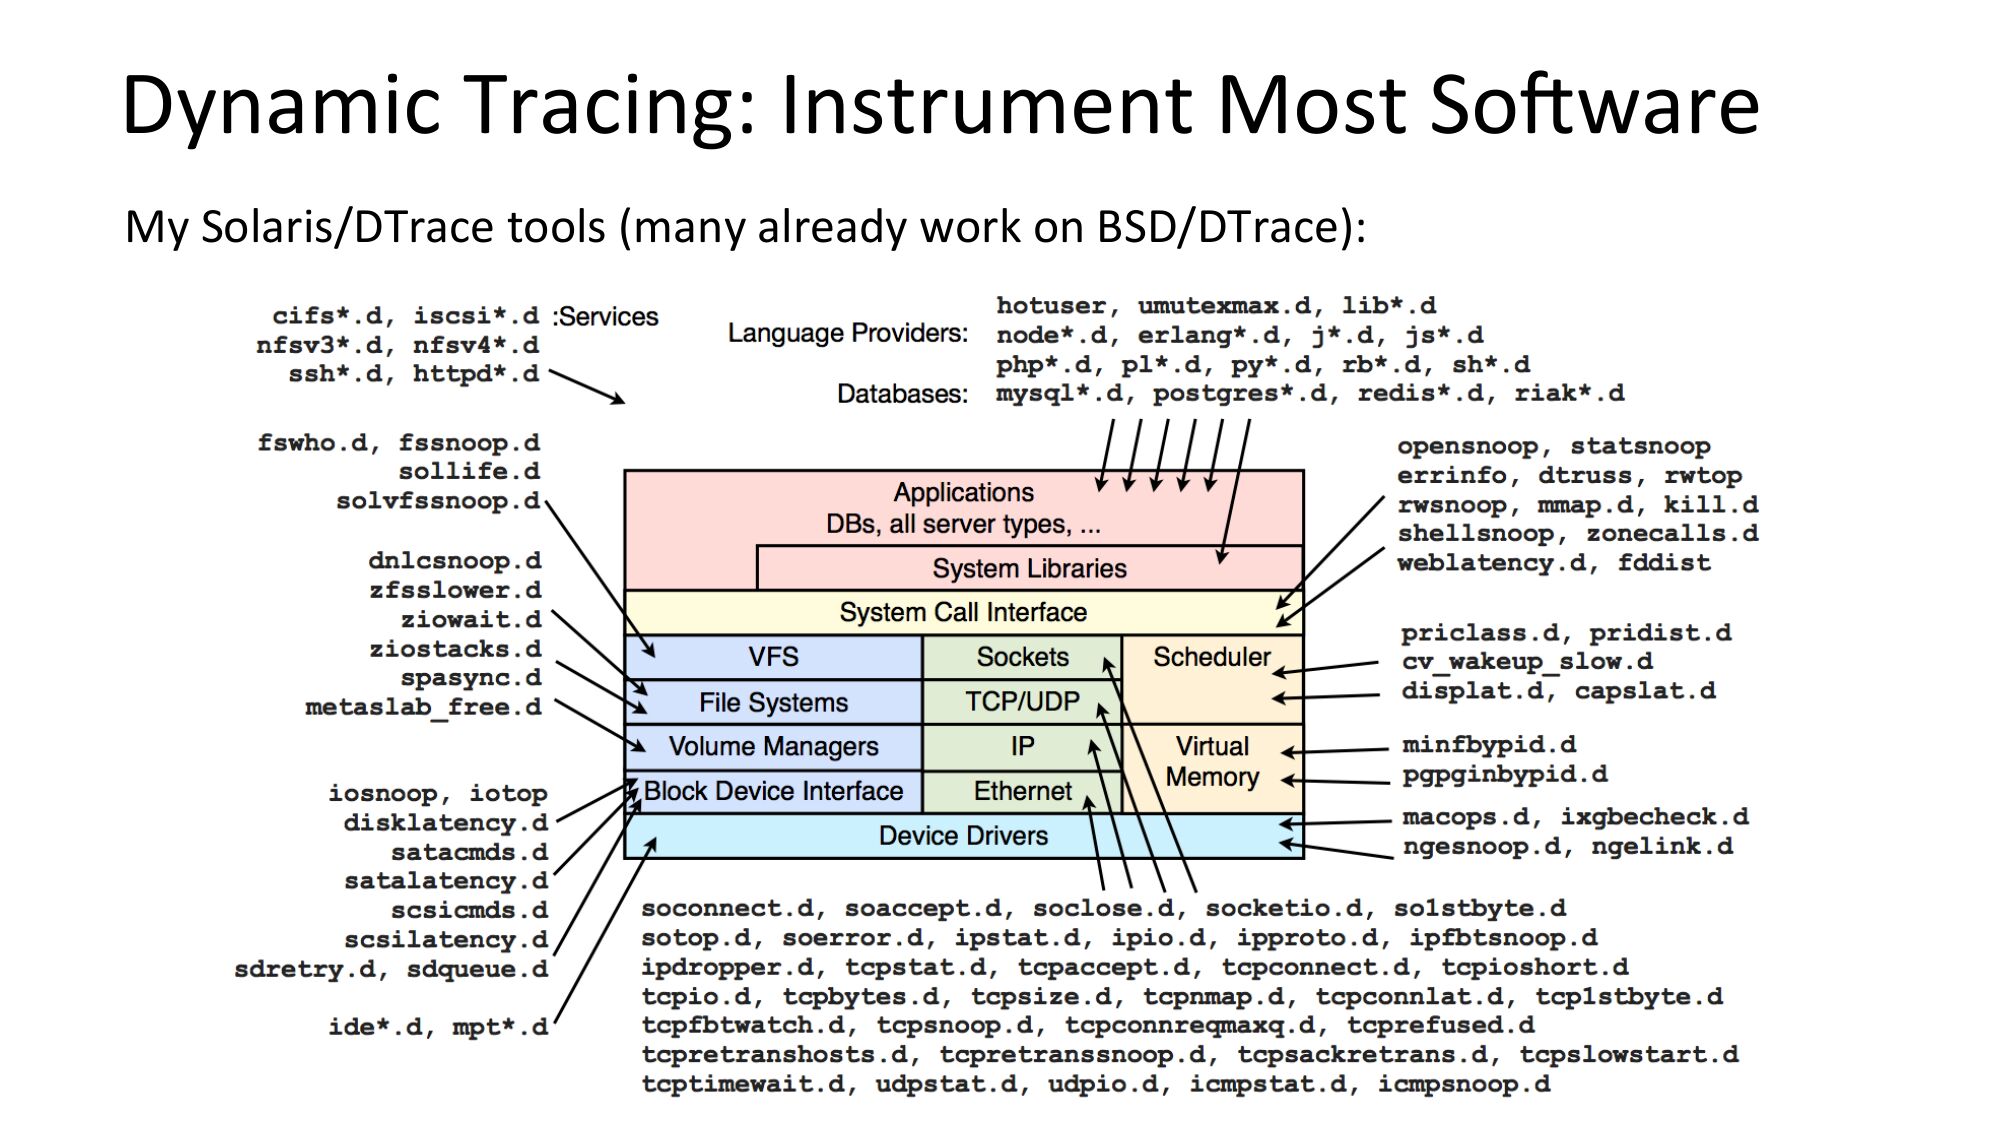
Dynamic Tracing: Instrument Most SoRware
My Solaris/DTrace tools (many already work on BSD/DTrace):
slide 61:
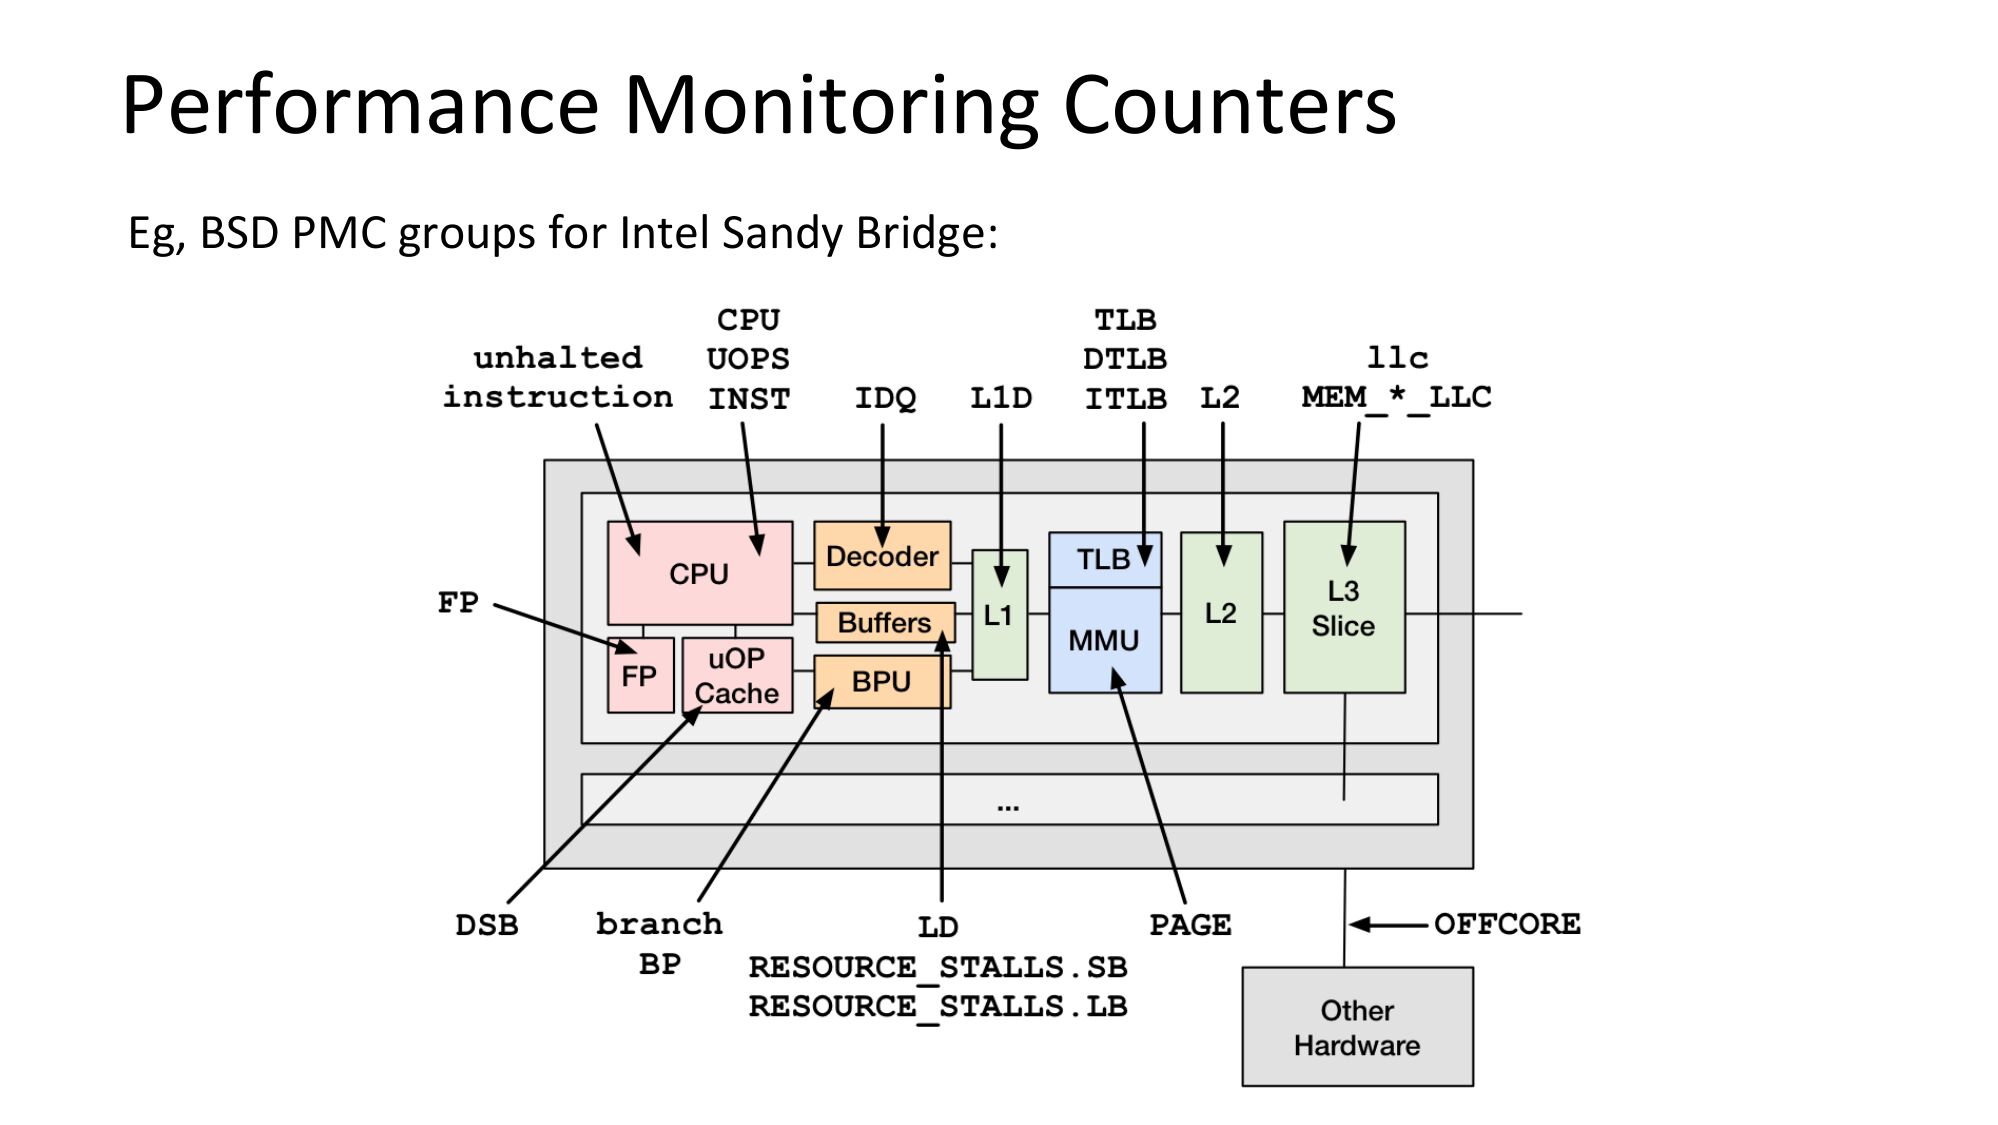
Performance Monitoring Counters
Eg, BSD PMC groups for Intel Sandy Bridge:
slide 62:
VisualizaNons
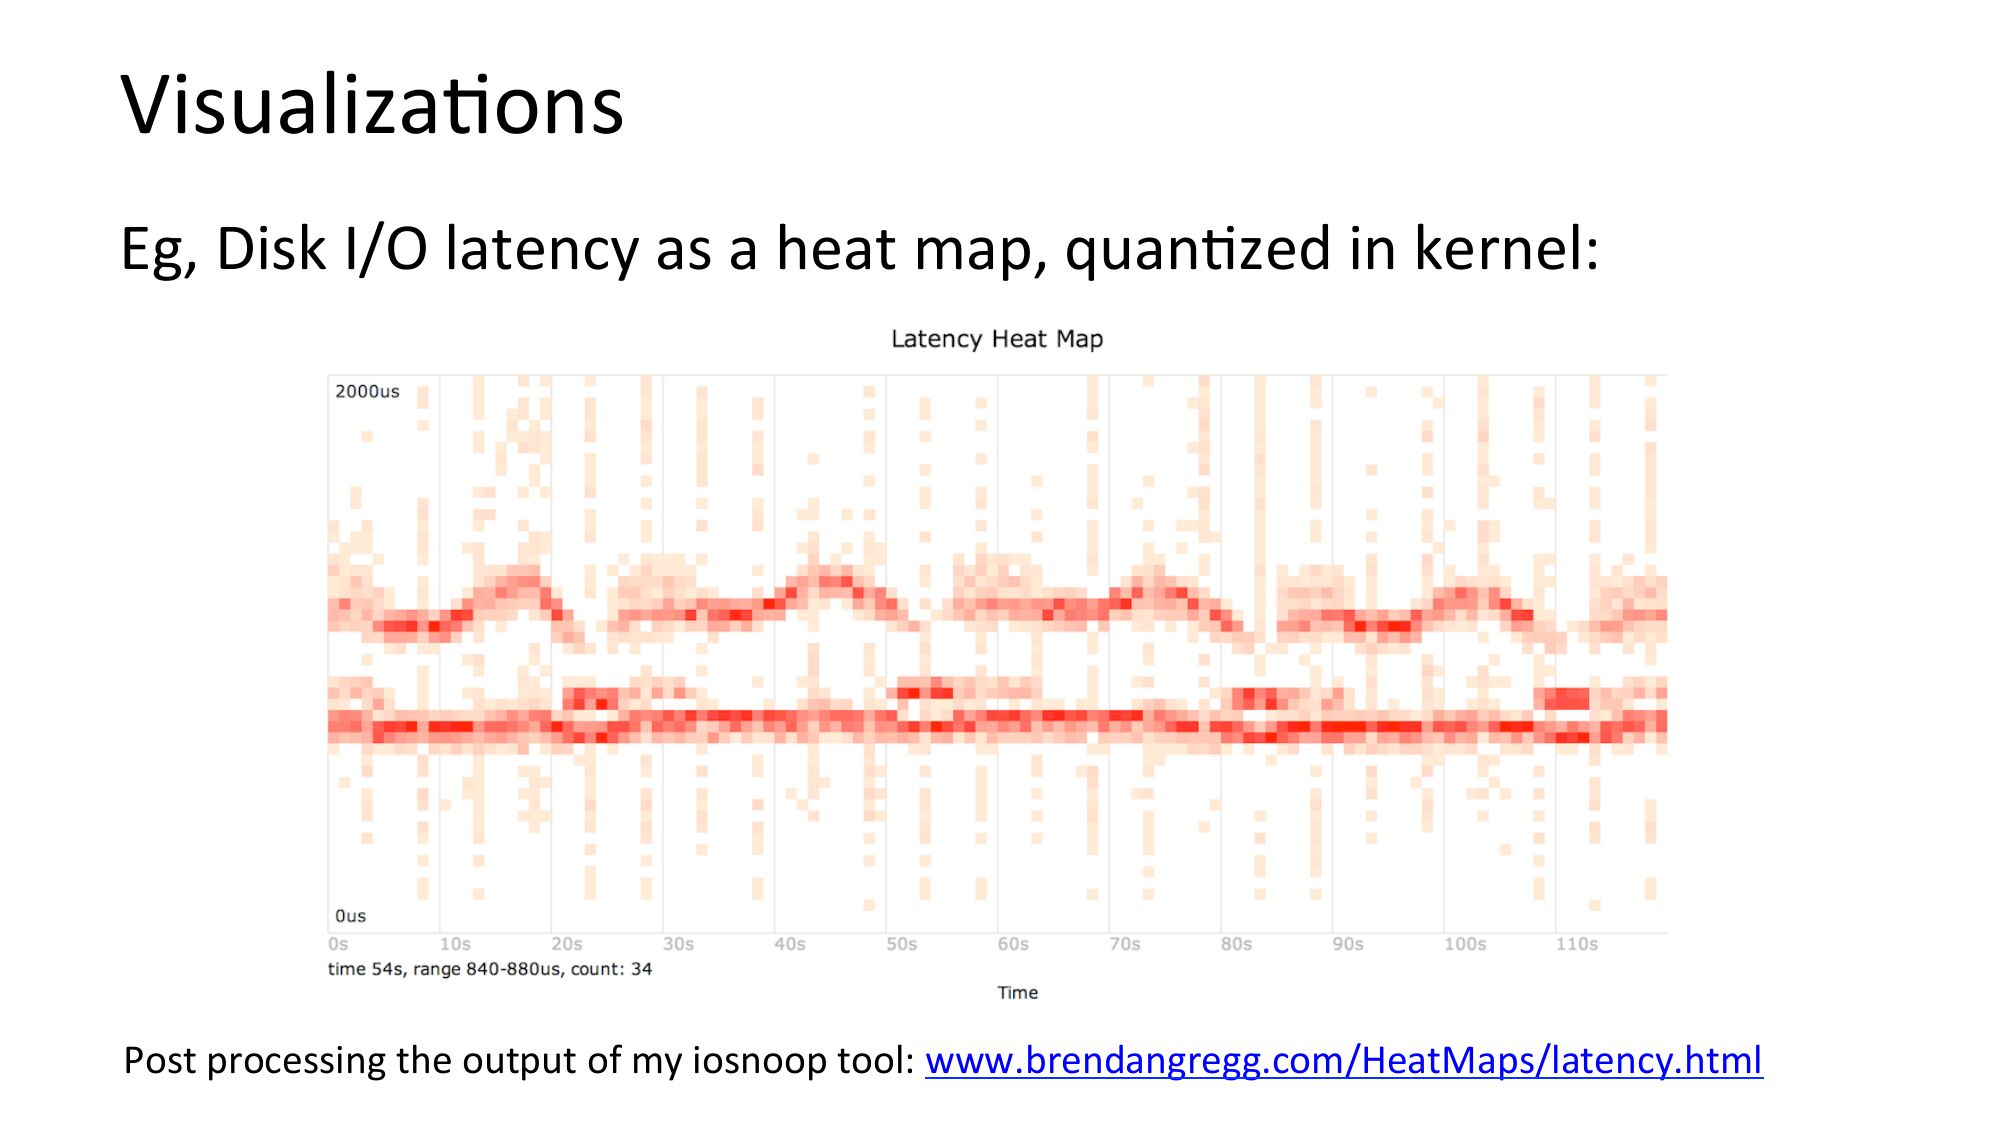
Eg, Disk I/O latency as a heat map, quanNzed in kernel:
Post processing the output of my iosnoop tool: www.brendangregg.com/HeatMaps/latency.html
slide 63:
Summary
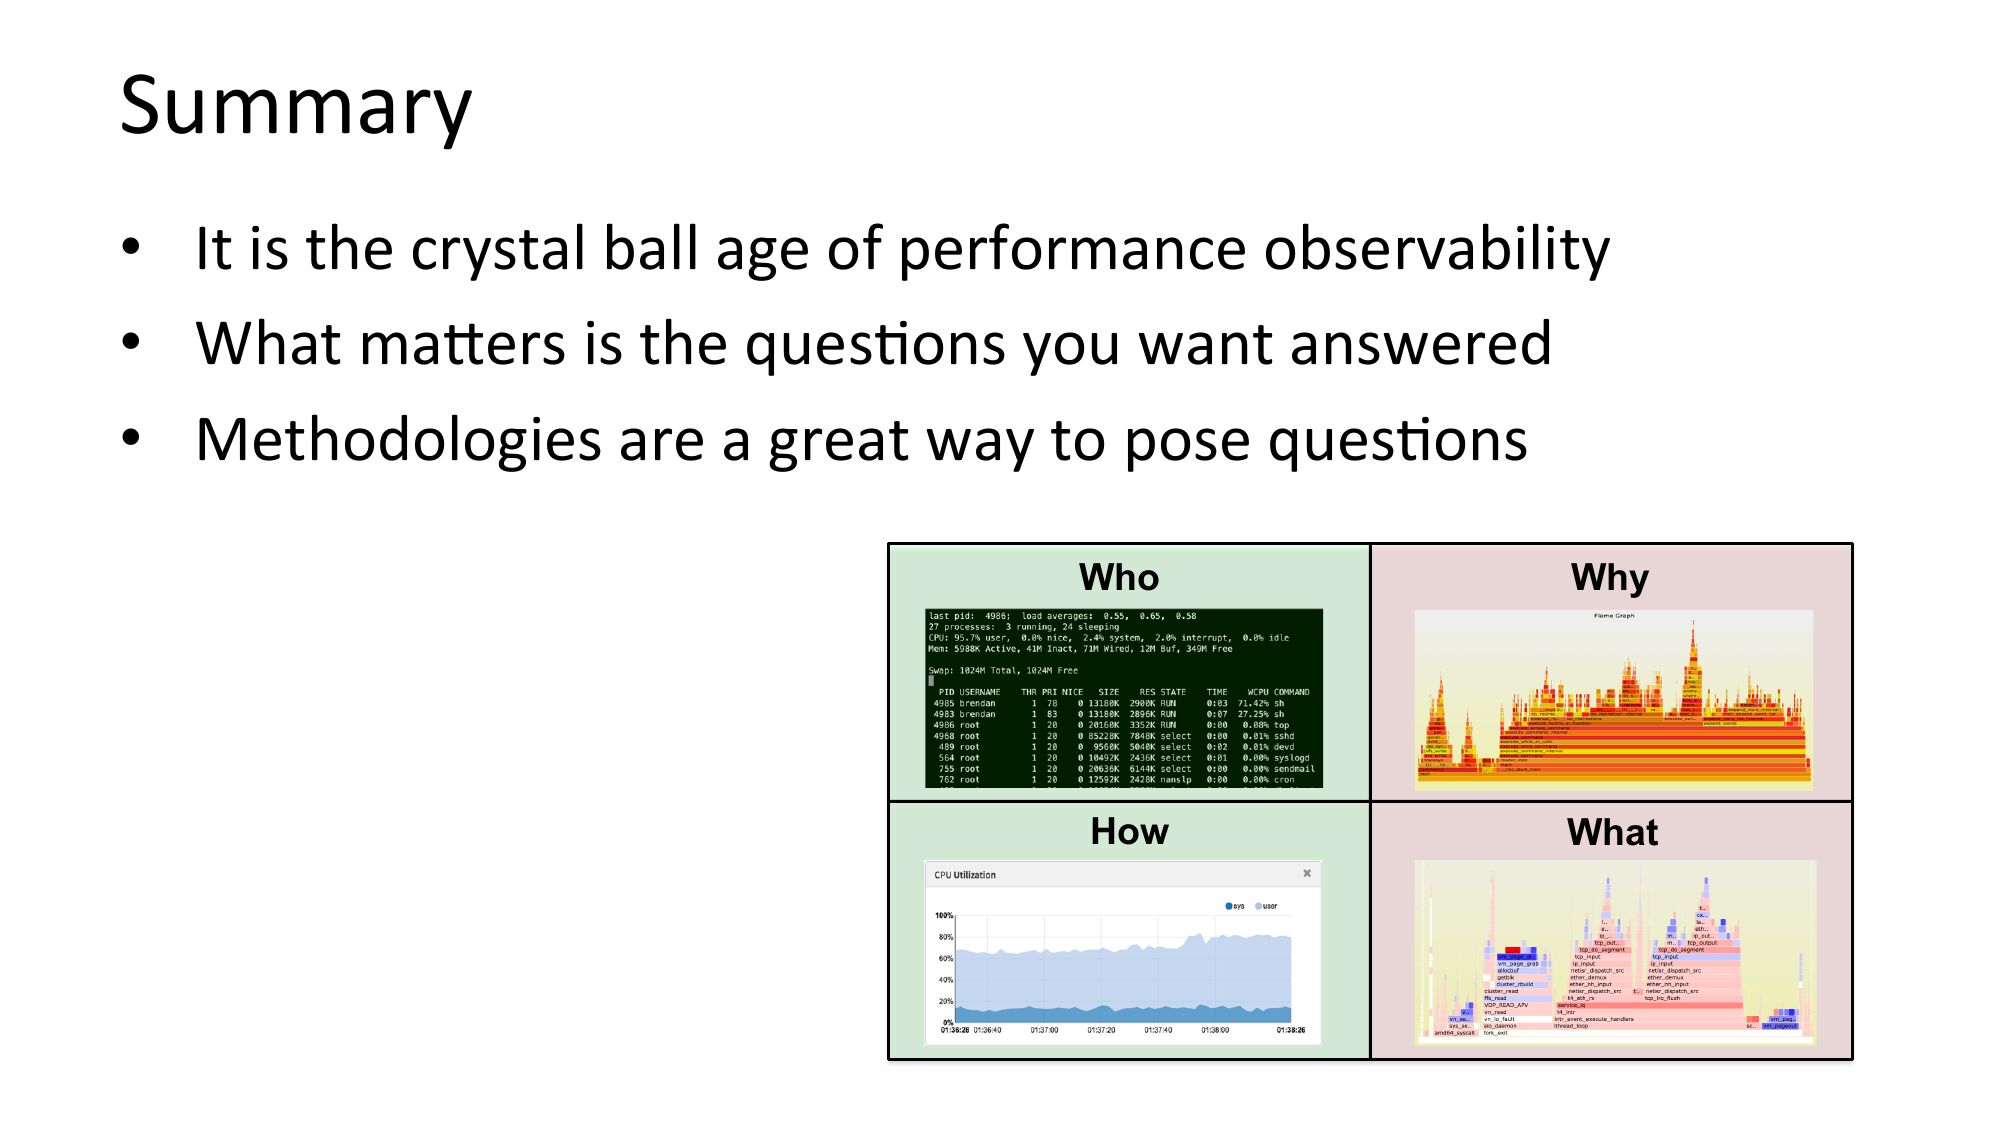
• It is the crystal ball age of performance observability
• What majers is the quesNons you want answered
• Methodologies are a great way to pose quesNons
Who
Why
How
What
slide 64:
References & Resources
FreeBSD @ Neylix:
hjps://openconnect.itp.neylix.com/
hjp://people.freebsd.org/~scojl/Neylix-BSDCan-20130515.pdf
hjp://www.youtube.com/watch?v=FL5U4wr86L4
USE Method
hjp://queue.acm.org/detail.cfm?id=2413037
hjp://www.brendangregg.com/usemethod.html
TSA Method
hjp://www.brendangregg.com/tsamethod.html
Off-CPU Analysis
hjp://www.brendangregg.com/offcpuanalysis.html
hjp://www.brendangregg.com/blog/2016-01-20/ebpf-offcpu-flame-graph.html
hjp://www.brendangregg.com/blog/2016-02-05/ebpf-chaingraph-prototype.html
StaNc Performance Tuning, Richard Elling, Sun blueprint, May 2000
RED Method: hjp://www.slideshare.net/weaveworks/monitoring-microservices
Other system methodologies
Systems Performance: Enterprise and the Cloud, PrenNce Hall 2013
hjp://www.brendangregg.com/methodology.html
The Art of Computer Systems Performance Analysis, Jain, R., 1991
Flame Graphs
hjp://queue.acm.org/detail.cfm?id=2927301
hjp://www.brendangregg.com/flamegraphs.html
hjp://techblog.neylix.com/2015/07/java-in-flames.html
Latency Heat Maps
hjp://queue.acm.org/detail.cfm?id=1809426
hjp://www.brendangregg.com/HeatMaps/latency.html
ARPA Network: hjp://www.computerhistory.org/internethistory/1960s
RSTS/E System User's Guide, 1985, page 4-5
DTrace: Dynamic Tracing in Oracle Solaris, Mac OS X, and FreeBSD, PrenNce Hall 2011
Apollo: hjp://www.hq.nasa.gov/office/pao/History/alsj/a11 hjp://www.hq.nasa.gov/alsj/alsj-LMdocs.html
slide 65:
EuroBSDcon 2017
Thank You
hjp://slideshare.net/brendangregg
hjp://www.brendangregg.com
[email protected]
@brendangregg


