For USENIX LISA 2016 I gave a talk that was years in the making, on Linux bcc/BPF analysis tools.
"Time to rethink the kernel" - Thomas Graf
Thomas has been using BPF to create new network and application security technologies (project Cilium), and build something that's starting to look like microservices in the kernel (video). I'm using it for advanced performance analysis tools that do tracing and profiling. Enhanced BPF might still be new, but it's already delivering new technologies, and making us rethink what we can do with the kernel.
My LISA 2016 talk begins with a 15 minute demo, showing the progression from ftrace, then perf_events, to BPF (due to the audio/video settings, this demo is a little hard to follow in the full video, but there's a separate recording of just the demo here: Linux tracing 15 min demo). Below is the full talk video (youtube):
Here are the slides or as a PDF:
Installing bcc/BPF
To try out BPF for performance analysis you'll need to be on a newer kernel: at least 4.4, preferably 4.9. The main front end is currently bcc (BPF compiler collection), and there are install instructions on github, which keep getting improved. For Ubuntu, installation is:
echo "deb [trusted=yes] https://repo.iovisor.org/apt/xenial xenial-nightly main" | sudo tee /etc/apt/sources.list.d/iovisor.list
sudo apt-get update
sudo apt-get install bcc-tools
There's currently a pull request to add snap instructions, as there are nightly builds for snappy as well.
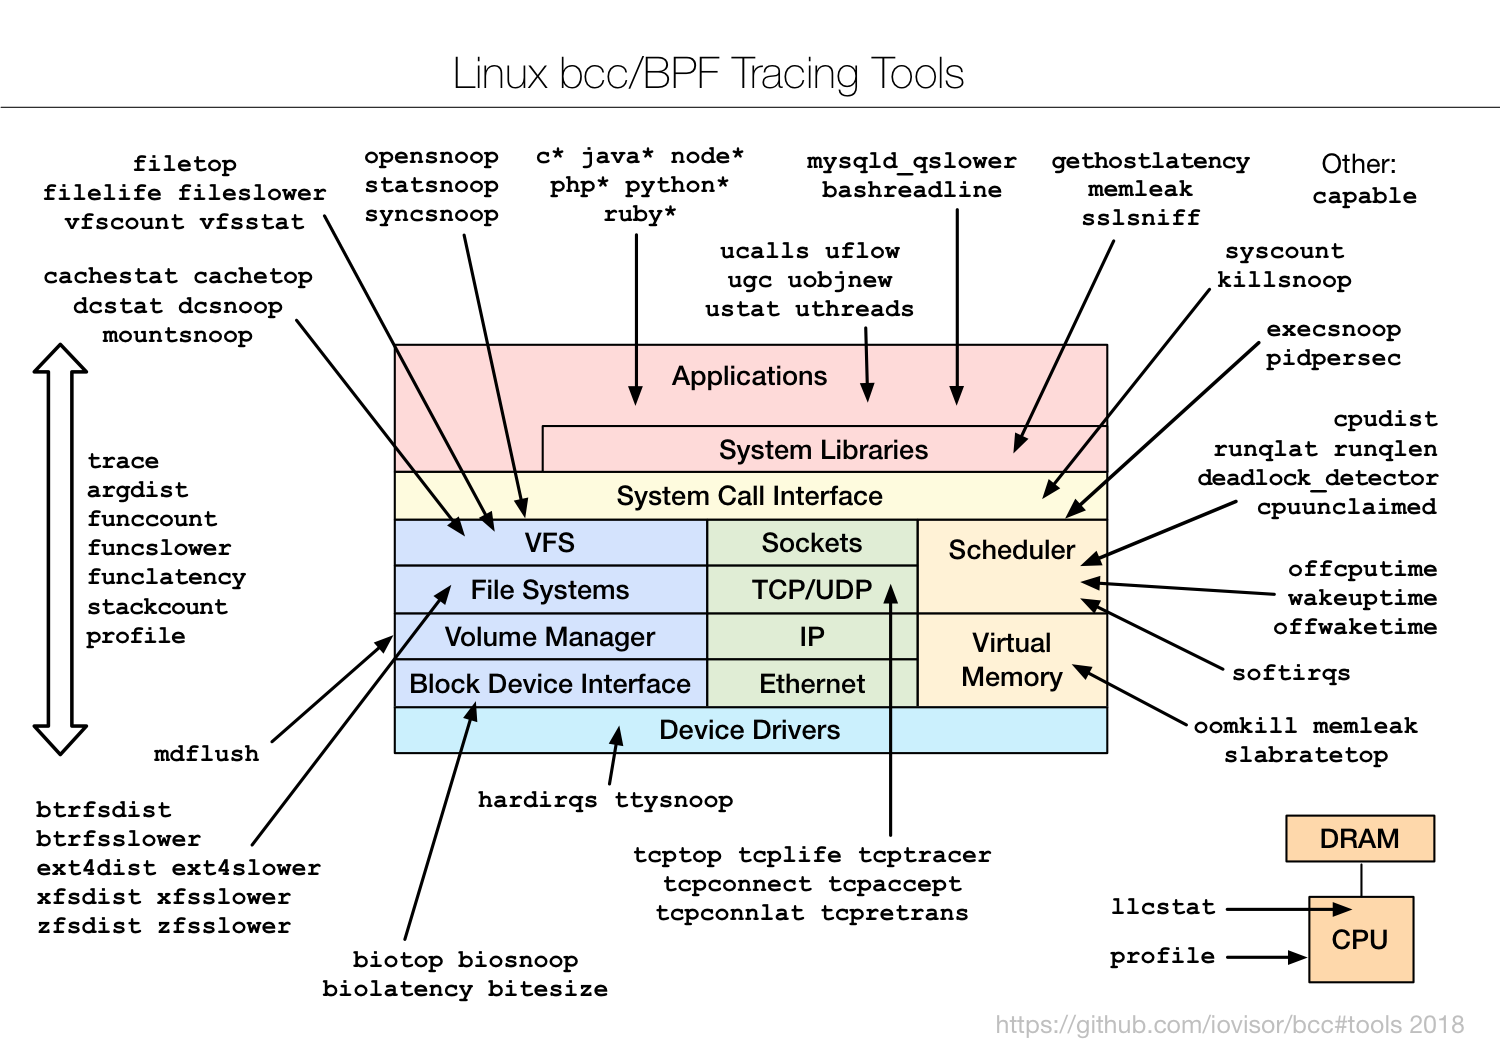
Listing bcc/BPF Tools
This install will add various performance analysis and debugging tools to /usr/share/bcc/tools. Since some require a very recent kernel (4.6, 4.7, or 4.9), there's a subdirectory, /usr/share/bcc/tools/old, which has some older versions of the same tools that work on Linux 4.4 (albeit with some caveats).
# ls /usr/share/bcc/tools
argdist       cpudist            filetop         offcputime   solisten    tcptop    vfsstat
bashreadline  cpuunclaimed       funccount       offwaketime  sslsniff    tplist    wakeuptime
biolatency    dcsnoop            funclatency     old          stackcount  trace     xfsdist
biosnoop      dcstat             gethostlatency  oomkill      stacksnoop  ttysnoop  xfsslower
biotop        deadlock_detector  hardirqs        opensnoop    statsnoop   ucalls    zfsdist
bitesize      doc                killsnoop       pidpersec    syncsnoop   uflow     zfsslower
btrfsdist     execsnoop          llcstat         profile      tcpaccept   ugc
btrfsslower   ext4dist           mdflush         runqlat      tcpconnect  uobjnew
cachestat     ext4slower         memleak         runqlen      tcpconnlat  ustat
cachetop      filelife           mountsnoop      slabratetop  tcplife     uthreads
capable       fileslower         mysqld_qslower  softirqs     tcpretrans  vfscount
Just by listing the tools, you might spot something you want to start with (ext4*, tcp*, etc). Or you can browse the following diagram:

Using bcc/BPF
If you don't have a good starting point, in the bcc Tutorial I included a generic checklist of the first ten tools to try. I also included this in my LISA talk:
- execsnoop
- opensnoop
- ext4slower (or btrfs*, xfs*, zfs*)
- biolatency
- biosnoop
- cachestat
- tcpconnect
- tcpaccept
- tcpretrans
- runqlat
- profile
Most of these have usage messages, and are easy to use. They'll need to be run as root. For example, execsnoop to trace new processes:
# /usr/share/bcc/tools/execsnoop
PCOMM            PID    PPID   RET ARGS
grep             69460  69458    0 /bin/grep -q g2.
grep             69462  69458    0 /bin/grep -q p2.
ps               69464  58610    0 /bin/ps -p 308
ps               69465  100871   0 /bin/ps -p 301
sleep            69466  58610    0 /bin/sleep 1
sleep            69467  100871   0 /bin/sleep 1
run              69468  5160     0 ./run
[...]
And biolatency to record an in-kernel histogram of disk I/O latency:
# /usr/share/bcc/tools/biolatency
Tracing block device I/O... Hit Ctrl-C to end.
^C
     usecs               : count     distribution
         0 -> 1          : 0        |                                        |
         2 -> 3          : 0        |                                        |
         4 -> 7          : 0        |                                        |
         8 -> 15         : 0        |                                        |
        16 -> 31         : 0        |                                        |
        32 -> 63         : 0        |                                        |
        64 -> 127        : 0        |                                        |
       128 -> 255        : 0        |                                        |
       256 -> 511        : 64       |**********                              |
       512 -> 1023       : 248      |****************************************|
      1024 -> 2047       : 29       |****                                    |
      2048 -> 4095       : 18       |**                                      |
      4096 -> 8191       : 42       |******                                  |
      8192 -> 16383      : 20       |***                                     |
     16384 -> 32767      : 3        |                                        |
Here's its USAGE message:
# /usr/share/bcc/tools/biolatency -h
usage: biolatency [-h] [-T] [-Q] [-m] [-D] [interval] [count]

Summarize block device I/O latency as a histogram

positional arguments:
  interval            output interval, in seconds
  count               number of outputs

optional arguments:
  -h, --help          show this help message and exit
  -T, --timestamp     include timestamp on output
  -Q, --queued        include OS queued time in I/O time
  -m, --milliseconds  millisecond histogram
  -D, --disks         print a histogram per disk device

examples:
    ./biolatency            # summarize block I/O latency as a histogram
    ./biolatency 1 10       # print 1 second summaries, 10 times
    ./biolatency -mT 1      # 1s summaries, milliseconds, and timestamps
    ./biolatency -Q         # include OS queued time in I/O time
    ./biolatency -D         # show each disk device separately
In /usr/share/bcc/tools/docs or the tools subdirectory on github, you'll find _example.txt files for every tool which have screenshots and discussion. Check them out! There are also man pages under man/man8.
For more information, please watch my LISA talk at the top of this post when you get a chance, where I explain Linux tracing, BPF, bcc, and tour various tools.
What's Next?
My prior talk at LISA 2014 was New Tools and Old Secrets (perf-tools), where I showed similar performance analysis tools using ftrace, an older tracing framework in Linux. I'm still using ftrace, not just for older kernels, but for times where it's more efficient (eg, kernel function counting using the funccount tool). BPF is programmatic, and can do things that ftrace can't.
Doing ftrace at LISA 2014, then BPF at LISA 2016, you might wonder I'll propose for LISA 2018. We'll see. I could be covering a higher-level BPF front-end (eg, ply, if it gets finished), or a BPF GUI (eg, via Netflix Vector), or I could be focused on something else entirely. Tracing was my priority when Linux lacked various capabilities, but now that's done, there are other important technologies to work on...


Click here for Disqus comments (ad supported).