Frequency Trails: Detecting Outliers
In computer performance, we're especially concerned about latency outliers: very slow database queries, application requests, disk I/O, etc. The term "outlier" is subjective: there is no rigid mathematical definition. From [Grubbs 69]:
An outlying observation, or "outlier," is one that appears to deviate markedly from other members of the sample in which it occurs.
Outliers are commonly detected by comparing the maximum value in a data set to a custom threshold, such as 50 or 100 ms for disk I/O. This requires the metric to be well understood beforehand, as is usually the case for application latency and other key metrics. However, we are also often faced with a large number of unfamiliar metrics, where we don't know the thresholds in advance.
There are a number of proposed tests for outliers which don't rely on thresholds. If such a test works, outliers can be detected from any performance metric.
I'll explain outliers using a visualization, and propose a simple test for their detection. I'll then use it on synthetic and then real world distributions. The results are surprising.
Visualization
This is disk I/O latency from a production cloud server as a frequency trail, showing 10,000 I/O latency measurements from the block device interface level:

Outliers can be seen as distant points on the right.
Problem
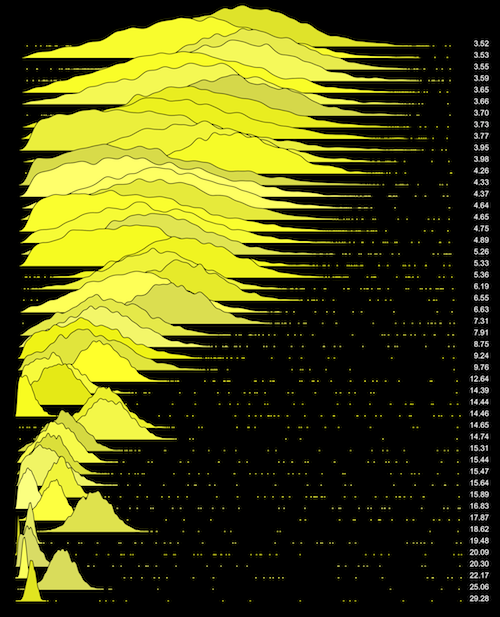
Now consider the following 25 synthetic random distributions, shown as filled frequency trails. These have been colored different shades of yellow to help differentiate overlaps. The purpose is to compare the distance from the bulk of the data to the outliers, which look like grains of sand.
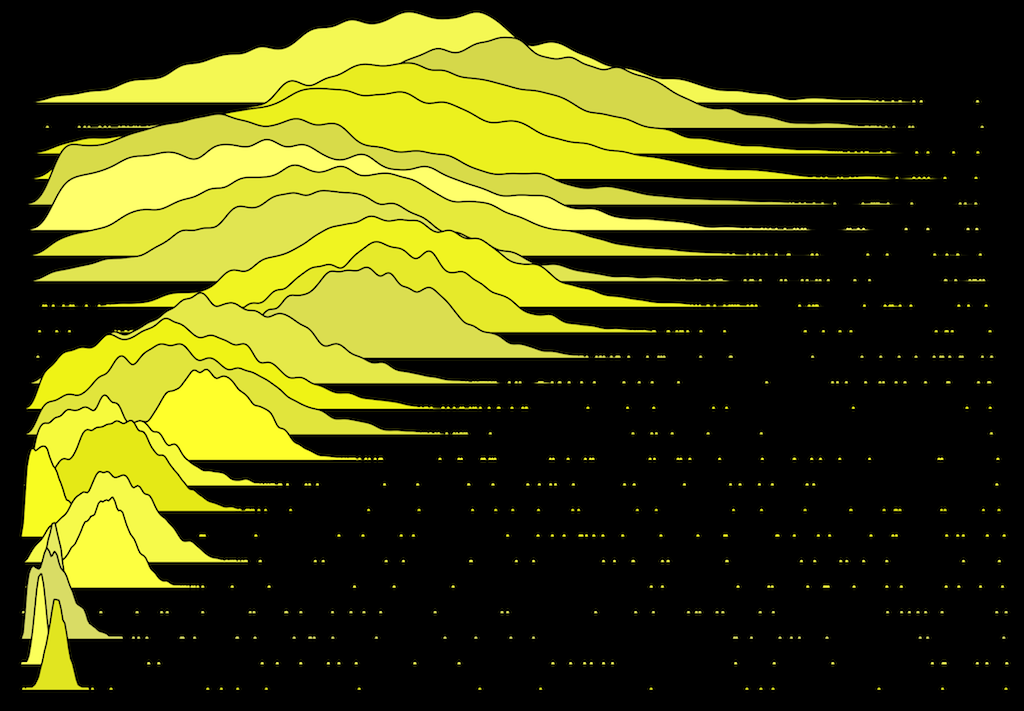
Many of these appear to have outliers: values that deviate markedly from other members of the sample. Which ones?
Six Sigma Test
This identifies the presence of outliers based on their distance from the bulk of the data, and should be relatively easy to understand and implement. First, calculate the max sigma:
maxσ = (max(x) - μ) / σ
This is how far the max is above the mean, μ, in units of standard deviation, σ (sigma).
The six sigma test is then:
outliers = (maxσ >= 6)
If any measurement exceeds six standard deviations, we can say that the sample contains outliers.
Using the earlier disk I/O data set:

Click the image to see 6σ and the mean, standard deviation, and 99th percentile for comparison.
Visualizing Sigma
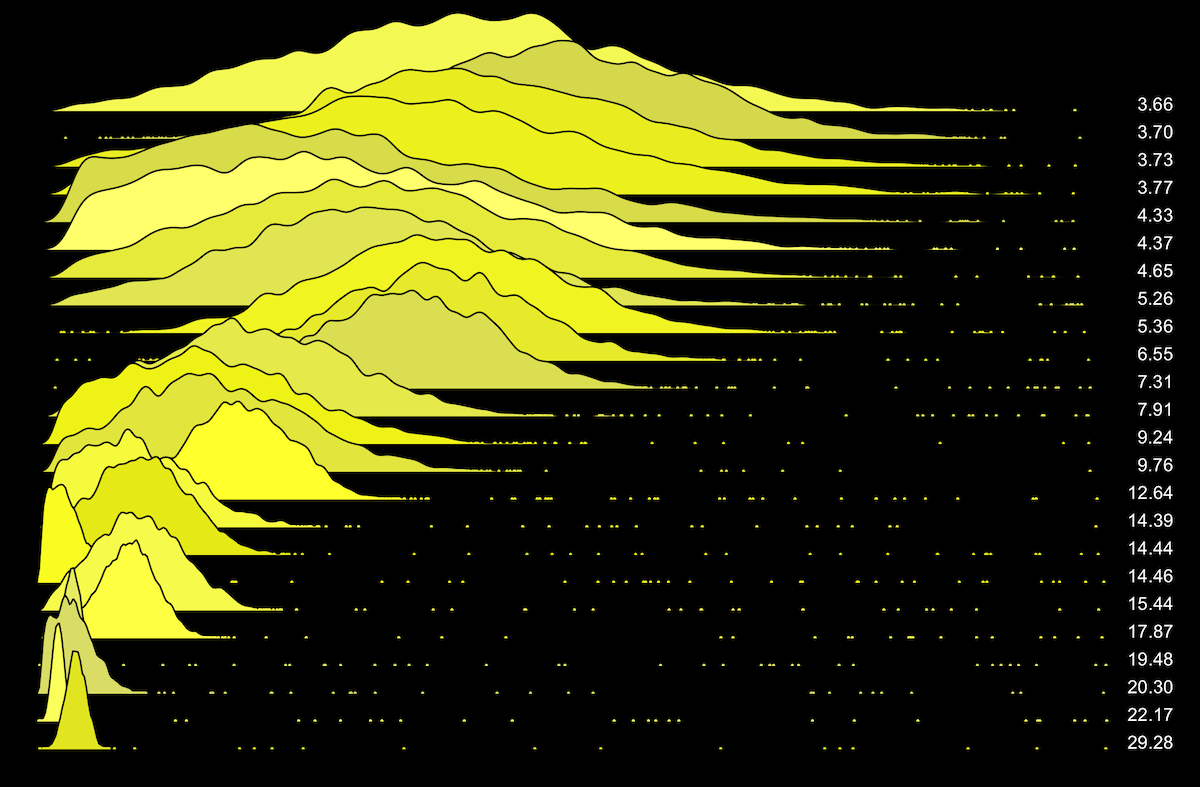
Here are the earlier distributions with their max sigma values on the right:
You can use this to understand how max sigma scales, and what 6σ will and won't identify. There is also a version with 100 distributions, and non-colored white and black versions.
Here is another set, which has different distribution types and numbers of modes.
The six sigma test appears to works well for these synthetic distributions. If you wish to use a different sigma value, you can use these plots to help guide your choice.
Disk I/O Latency Outliers
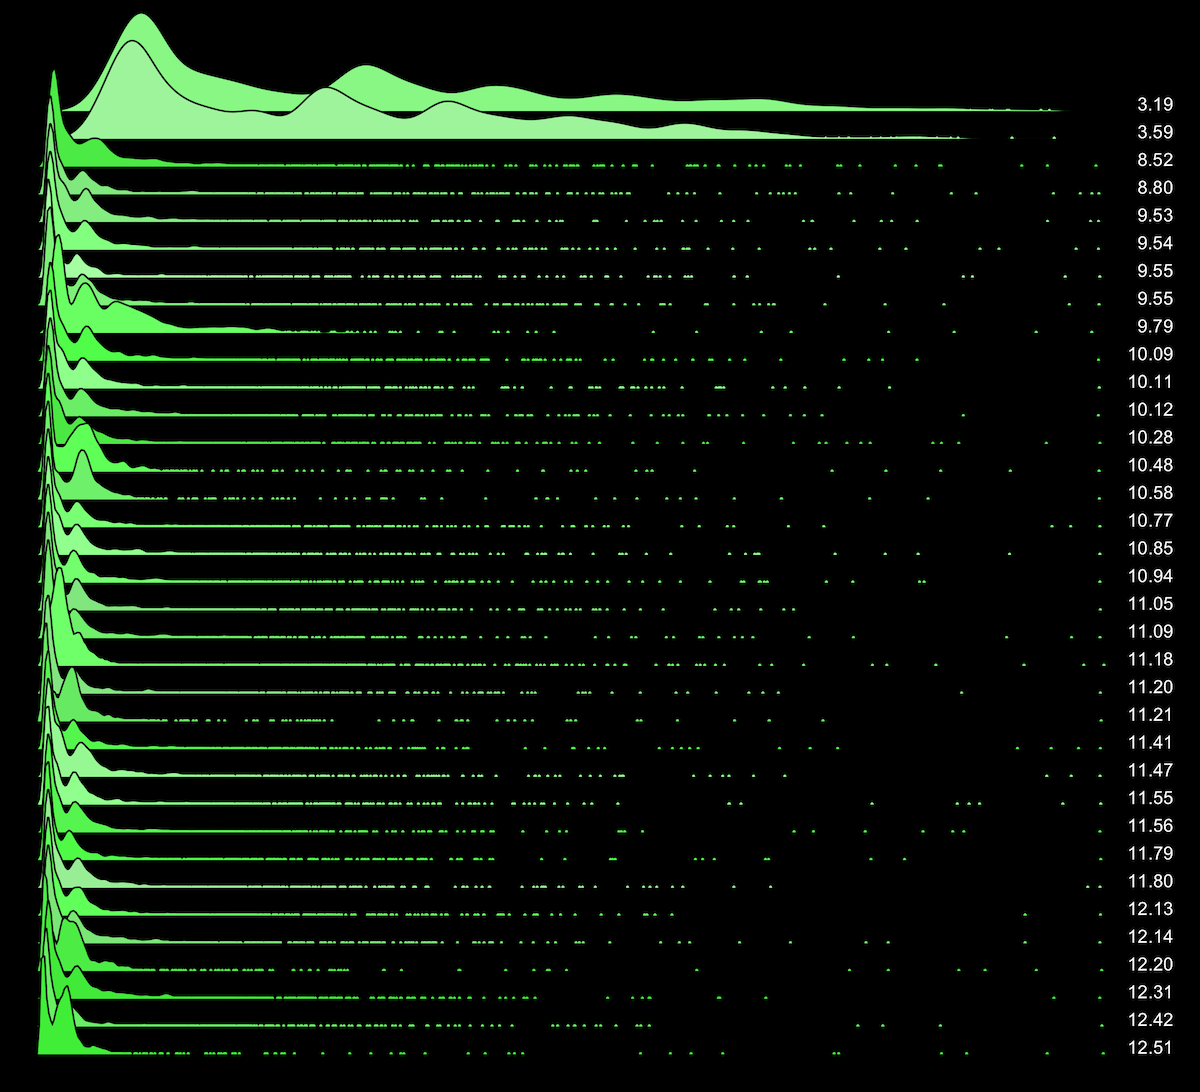
Now for real data. The following are 35 disk I/O latency distributions, each with 50,000 I/O, sorted on max sigma, and with the x-axis scaled for each frequency trail:
One characteristic that may stand out is that many of these distributions aren't normal: they are combinations of bimodal and log-normal. This is expected: the lower latency mode is for disk cache hits, and the higher latency mode is for disk cache misses, which also has queueing creating a tail. The presence of two modes and a tail increases the standard deviation, and thus, lowers max sigma.
All of these distributions still have outliers according to the six sigma test. And this is just the top 35: see the full 200 disk I/O distributions (white, black), from 200 random production servers.
100% of these servers have latency outliers
I've tackled many disk I/O latency outlier issues in the past, but haven't had a good sense for how common outliers really are. For my datacenter, disks, environment, and during a 50,000 I/O span, this visualization shows that latency outliers are very common indeed.
MySQL Latency Outliers
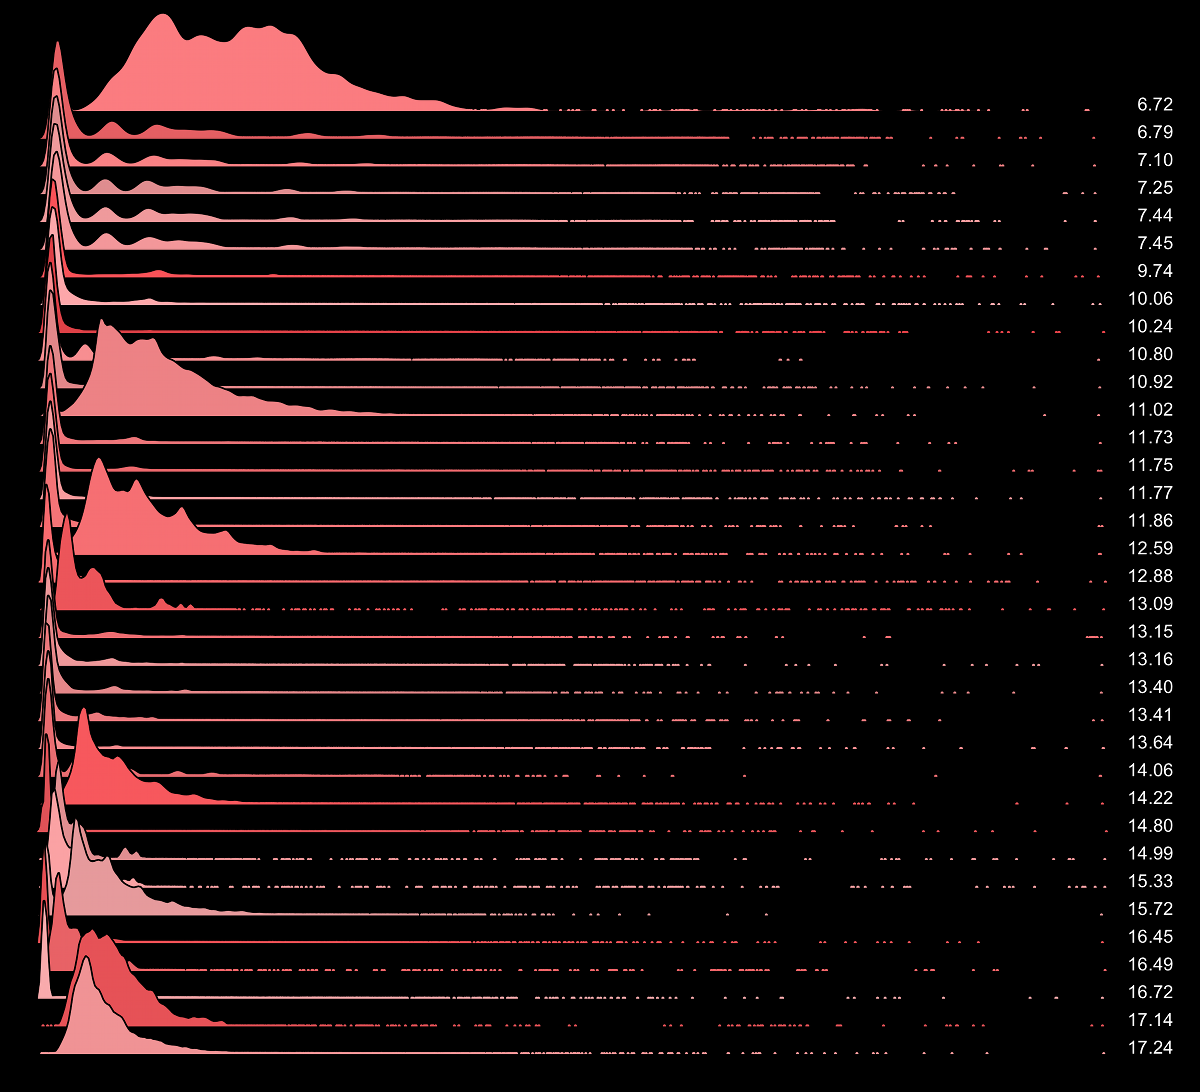
Here are 35 MySQL command latency distributions, from about 5,000 measurements each:
This is from 100 random MySQL production servers, where 96% have 6σ outliers.
Node.js Latency Outliers
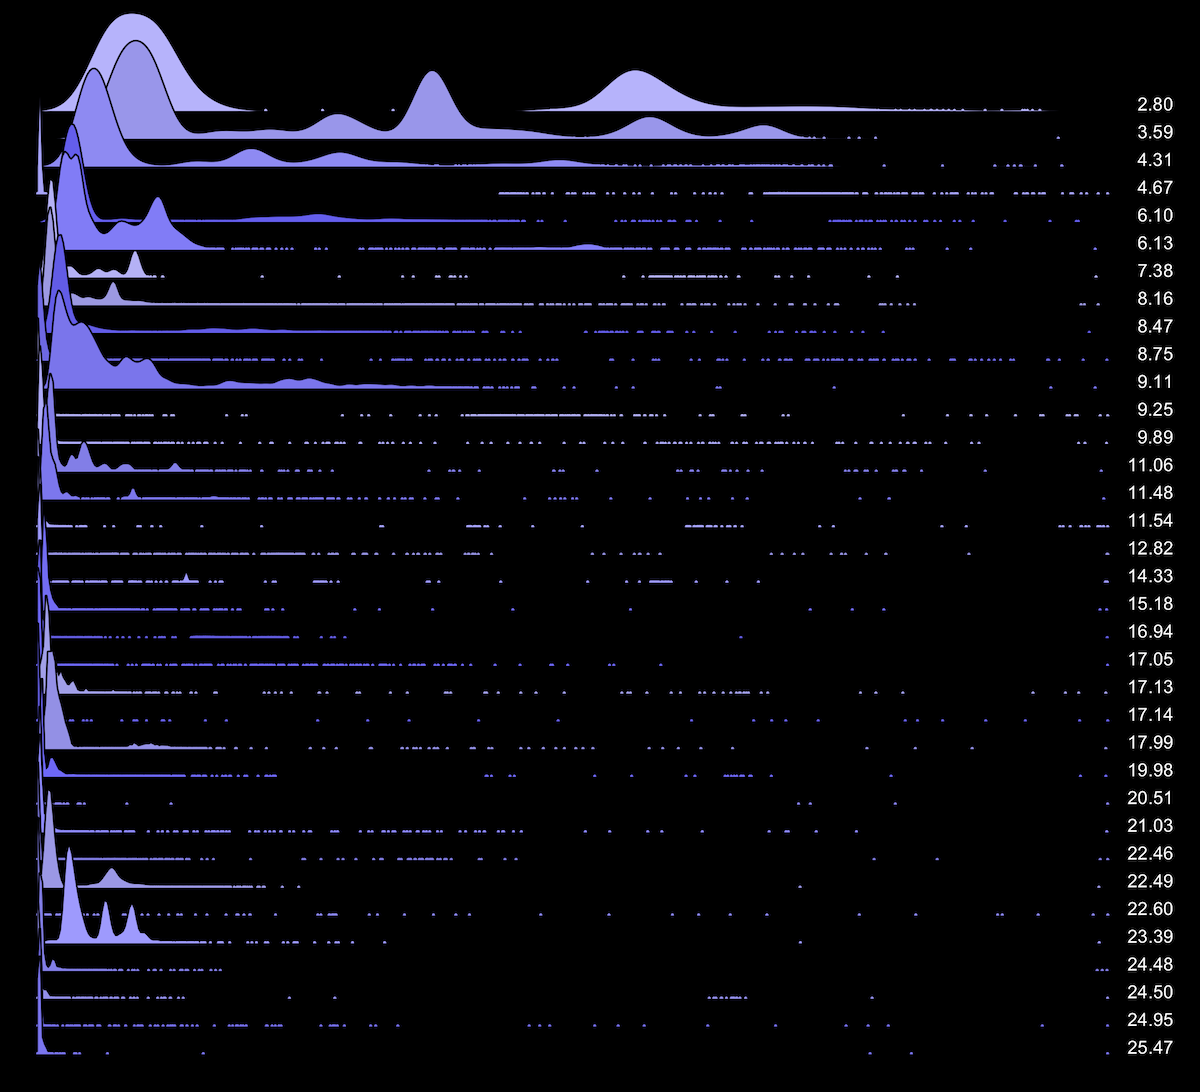
Here are 35 node.js HTTP server response time distributions, from about 5,000 measurements each:
This is from 100 random node.js production servers, where 98% have 6σ outliers.
The Implications of Outliers
The presence of outliers in a dataset has some important implications:
- There may be much greater values – outliers – than the average and standard deviation suggest. Use a way to examine them, such as a visualization or listing them beyond a threshold (eg, 6σ). At the very least, examine the maximum value.
- You can't trust the average or standard deviation to reflect the bulk of the data, as they may be slightly influenced by outliers. For the bulk of the data, you can try using robust statistics such as the median and the median absolute deviation (MAD).
In a recent severe case, the mean application response time was over 3 ms. However, explaining this value alone was futile. Upon studying the distribution, I saw that mosts requests were around 1 ms, as was the median - but there were outliers taking up to 30 seconds!
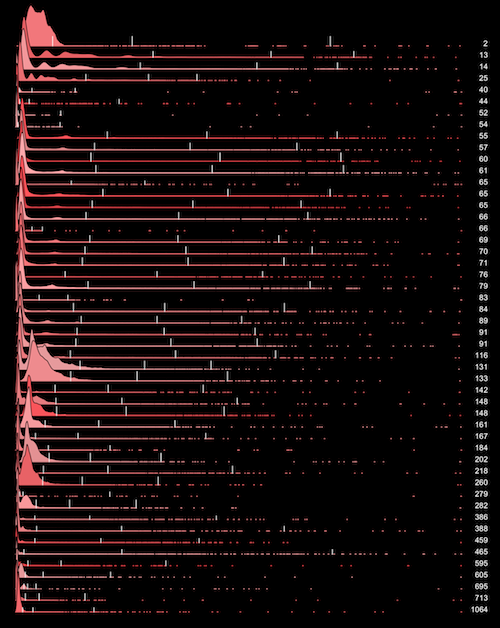
While outliers can be a performance problem, they aren't necessarily so. Here are the same 200 disk I/O distributions, numbered and sorted based on their max latency in milliseconds (white, black). Only 80% of these have latency outliers based on a 50 ms threshold. For some distributions, 1 ms exceeds 6σ, as the bulk of the I/O were much faster.
Next Steps
After identifying the presence of outliers, you can examine them visually using using a histogram, frequency trail, scatter plot, or heat map. For all of these, a labeled axis can be included to show the value range, indicating the maximum value reached.
Their values can also be studied individually, by only listing those beyond 6σ in the sample. Extra information can then be collected, which would have been too much detail for the entire data set.
What Causes Outliers?
Outliers, depending on their type, may have many causes. To give you an idea for latency outliers:
- Network or host packet drops, and TCP timeout-based retransmits.
- DNS timeouts.
- Paging or swapping.
- Lock contention.
- Application software scalability issues.
- Errors and retries.
- CPU caps, and scheduler latency.
- Preemption by higher priority work (kernel/interrupts).
- Some guy shouting at your disks.
Implementing Sigma Tests
For these examples, latency measurements were individually logged and then post-processed using R. To gather these latency measurements, any tracing tool can be used (eg, Linux perf_events, DTrace, ...), as well as application logs.
There are a number of ways to implement this in real-time. By use of cumulative statistics, the mean and standard deviation can be known for the entire population since collection began. The max can then be compared to these cumulative metrics when each event (I/O or request) completes, and then the max sigma can be calculated and maintained in a counter.
For example: the disk I/O statistics reported by iostat(1), which instrument the block device layer, are maintained in the kernel as a group of statistics which are the totals since boot. For the Linux kernel, these are the eleven /proc/diskstats as documented in Documentation/iostats.txt, and maintained in the kernel as struct disk_stats. A member to support calculating the standard deviation can be added, which has the cumulative square of the difference to the mean, as well as max sigma and maximum members. These would be updated during blk_account_io_done(), when the duration of the I/O is known, by a call similar to part_stat_add().
But distributions change over time, and such a max sigma could be thrown by changes in workload. Ideally, we want a mean and standard deviation that reflects recent activity, and we want them to be cheap to compute: not requiring storing thousands of measurements for repeated calculations.
Using DTrace, I can calculate the mean and standard deviation for traced measurements, and reset these counters periodically. For example:
# dtrace -qn 'io:::start { ts[arg0] = timestamp; }
    io:::done /ts[arg0]/ { this->t = timestamp - ts[arg0]; @s = stddev(this->t);
	@a = avg(this->t); @m = max(this->t); ts[arg0] = 0; }
    tick-1s { printa("%@d %@d %@d\n", @s, @a, @m);
	trunc(@s); trunc(@a); trunc(@m); }' | \
    awk '$1 > 0 { printf "max sigma: %.2f\n", ($3 - $2) / $1 }'
max sigma: 6.77
max sigma: 8.57
max sigma: 18.20
max sigma: 10.79
max sigma: 7.09
[...]
However, this may cause measurement spikes: I may need to skip calculating max sigma until the mean and standard deviation have settled, based on a minimum number of measurements. I could also have pairs of @s and @a, an active set used for max sigma calculations which were populated by the previous interval, and a passive set that is being populated by the current interval. These approaches should help, but aren't perfect.
While writing this document, I saw a great talk by Baron Schwartz at Velocity conf on Quantifying Abnormal Behavior, where he proposed using an Exponentially Weighted Moving Average (EWMA) for the mean and standard deviation. Aha! You may be familiar with EWMA's from load averages, where they dampen CPU load measurements. The EWMA mean and EWMA standard deviation could be maintained, cheaply, and also be the basis for the max sigma test, providing a value based on recent activity.
About Six Sigma
An advantage of this test is that it is composed of commonly-known statistical properties: the max, mean, and standard deviation. These are often available from existing performance analysis tools. And you probably don't need to learn more statistics to make use of it.
Given that this will be used for finite samples of measurements, it is really testing the sample mean (X̄) and sample standard deviation (s). This result is the same as finding the maximum Student's t-statistic, or the maximum standard score or Z value for the sample. The choice of 6 is subjective, and is based on the probability that this measurement happens by chance, from the sort of data sets we expect to analyze in computing: tens of thousands to millions of events, where each event is an I/O, request, operation, etc. For the normal distribution, the probability of a 6σ measurement is less than 1 in 500 million, calculated using the error function. For other distributions, the probability of 6σ differs. It is assumed to remain sufficiently unlikely to be suitable for outlier detection, even as the distribution type differs, and when σ is influenced by the outliers it detects.
If desired, a similar test can be conducted for the minimum value, or, the largest sigma from both max and min. This wasn't performed here, based on the intended use case of searching for high latency.
Answers to Anticipated Questions
A. I don't think 6σ is too high. This is subjective. For our purpose (particularly latency outliers), if it's < 6σ, it isn't the outliers we are looking for. Even though they may be outliers by other definitions: picture a single measurement with a large gap to the rest of the data (which can be identified by Dixon's Q test), but isn't more than 6σ. For example, a 50 ms outlier for disk I/O is not unlike what we are trying to identify. Assuming a uniform distribution of 1,000 I/O between, say, 0 and 10 ms, and one at 50 ms, the max in this case is 15σ. That makes 6σ sound low.
A. I don't think 6σ is too low, either. For Pareto-like distributions or those with long tails, 6σ measurements are more likely to occur as part of the distribution, which can lead to false identification of outliers (false positives). However, your next step should be to examine the outliers, at which point you can see that it is a false alarm. In performance analysis, it is better to make a false positive (type I error) which is then investigated and proven false (wasting time), than a false negative (type II error) which is not investigated, leaving an undiagnosed issue in the system, and more time wasted looking elsewhere.
A. It's useful in our case to call them outliers, even if they can be considered part of the same distribution as the bulk of the data, but with a very low probability. Especially when the distribution has a long tail. The aim here is to identify when something is worth further investigation. If that investigation shows we have a very long tail, then that's useful for our use cases (eg, latency).
A. The problem with using a robust statistic like MAD is that the user now must learn three things (the test, 6, MAD), instead of two (the test, 6). Is that really worth it?
A. I'm not using p-values either, to keep it simple.
Other Tests
There are many other tests for detecting outliers which you can try: Dixon's Q test – which examines gaps, Grubbs' test, Chauvenet's criterion, etc. You can also improve the accuracy of the 6σ test by using the MAD instead of the standard deviation ("mad max test"?), which I didn't do earlier to keep it simple. If you do experiment with other tests, it's helpful to generate waterfall frequency plots along with the values you are using for detection, to quickly see how well they are working, as I did here.
The simplest test is the use of a threshold, which are commonly used for outlier detection (eg, the MySQL slow queries log, which by default uses a threshold of one second). These should identify problem outliers with greater accuracy when the data set is well understood, and a reliable threshold can be chosen. This will often be the case for the three latency examples here: disk I/O, MySQL, and node.js. In comparison, the six sigma test works for any metric without prior knowledge, however, it also only identifies if a distribution has an outlier, but not if that outlier is a problem.
I didn't mention anything about using percentiles, which could be used as part of an outlier test via thresholds or an algorithm. I will leave you with the image on the right to contemplate. This shows 50 random servers with latency distributions of 50,000 disk I/O, and from left to right three percentiles are marked with a vertical white line: 90th, 99th, 99.9th. The max value, in ms, is on the right.
Conclusion
It's possible to test a distribution for outliers by expressing the distance of the max to the mean, in terms of standard deviation. If this exceeds 6, it may be called an outlier based on the six sigma test. While more sophisticated and accurate tests can be used, an advantage of this test is its simplicity.
I created and visualized synthetic distributions to show what 6σ will and won't identify. I then examined real world distributions of three types of latency, from disk I/O, MySQL, and node.js, and from over one hundred production servers. In all cases I found that between 96% and 100% of servers that were sampled had 6σ outliers.
It can be important to be aware when outliers are present, as these influence the mean and standard deviation. Outliers can also cause performance issues themselves, although this isn't necessarily the case. I showed this by visualizing the maximum latency of disk I/O, which for some distributions exceeded 6σ despite a maximum less than 10 ms. The outlier test is only useful to identify the presence of outliers; those outliers must then be examined further.
You may already use thresholds to detect outliers for key metrics. An outlier test, like that proposed here, is more useful for unfamiliar metrics for which you don't already have reliable thresholds.
References
- [Grubbs 69] Grubbs, F., E., Procedures for Detecting Outlying Observations in Samples, Technometrics, Feb 1969
- http://en.wikipedia.org/wiki/Standard_score
- http://en.wikipedia.org/wiki/Standard_deviation#Rules_for_normally_distributed_data
For more frequency trails, see the main page. For the next part in this series, see modes.
